See other Dead Constitution Articles
Title: Market Wrap-Up (11-23-2005)
Source:
[None]
URL Source: [None]
Published: ,
Author:
Post Date: 2005-11-23 23:58:10 by orangedog
Ping List: *unUsual Suspects* Subscribe to *unUsual Suspects*
Keywords: (11-23-2005), Wrap-Up, Market
Views: 467
Comments: 79
Home l Broadcast l Market Monitor l Top 10 l Storm Watch l Sitemap l About Us
Today's WrapUp by Chris Puplava 11.23.2005 Mon Tue Wed Thu Fri Archive
General Motors Corp. announced Monday that they will be closing 12 facilities in North America and cutting 30,000 jobs by 2008 due to declining sales and rising health care costs. This move would cut more than a fourth of its North American manufacturing jobs, which is 17% of its 173,000 hourly workforce (the average hourly worker is around 49 years old), with the move being called devastating by the United Auto Workers. GM is not alone as Ford Motor Co. announced last week that it plans to eliminate about 4,000 jobs in North America early next year in its own restructuring plan. GM has been under pressure from Asian rivals as its US market share has fallen from 33% ten years ago to 26.2% currently. Moreover, GM has lost nearly $4 billion in the first three quarters of the year. Toyota could be passing GM in worldwide production as Toyota expects to produce 8.1 million vehicles this year while GM expects to produce 9 million. GM is trying to cut costs and improve efficiency and said the plant closings will cut $7 billion off its $42 billion annual operations budget by the end of next year. The plant closings will decrease the number of vehicles made by GM in North America by 1 million a year by the end of 2008, down 30% from 2002. GM Chairman and Chief Executive Rick Wagoner said the plan would improve North American plants to run at 100% of their capacity compared to the current 85%. To put things into perspective, its no wonder Toyota has been soaring while GM has been falling with Toyota having the most productive plants in North America, operating at 107% capacity in 2004 according to Greg Gardner of Harbour Consulting, which measures manufacturing productivity. These arent the only troubling economic news coming out lately. The International Council of Shopping Centers (ICSC-UBS), which reports a weekly tally of store sales, said in a special consumer question that 59% of those polled said high gasoline prices are reducing their discretionary spending. Interestingly, this percentage is greater than the 54% level in late September when consumers were faced with gas prices at $3. High gas prices, shaky consumer confidence, and an uncertain jobs market are clouding the outlook for holiday sales. Looking at leading economic indicators also points to an economic slowdown, troubling news for the stock market which typically peaks before the business cycle does. The October job growth proved disappointing as non-farm payrolls rose a much smaller-than-expected 56,000. The overall weakness was centered in service-producing jobs, which rose only 7,000. Retail trade declined 5,000 with a sharp 8,000 decline at auto dealers whose sales suffered badly in the month. Leisure jobs were especially hit hard, down 18,000. The Labor Department said the weak growth was probably not tied to Katrina, and that job growth outside the Gulf Area was below trend. It did note that high gas prices could have dampened the jobs market including hiring in vacation industries, confirming the ICSCs special consumer question mentioned above. Surprisingly the Labor Department said Hurricane Rita had only a minimal impact and that Wilma hit too late in the month to be included in the data.
When looking at the graph above, a clear correlation can be seen with non-farm payrolls and the S&P 500. The bottom of the recent bear market was in October 2002 followed by a sharp rally that began in mid-2003 before slowing down in 2004 and 2005. As 2005 has seen a relative flat market, the non-farm payrolls have shown a broad top which peaked on a year over year % increase in January of this year and appear to be rolling over. Another recessionary indicator, new jobless claims, which has a significant inverse correlation with the stock market, also shows a concerning trend. The chart below shows the inverse correlation between the S&P 500 and new jobless claims
Notice the bottoming seen in 2000 over a period of a few months then the about face continuing on a sharp incline before slowing in 2002. The broad peak seen in new jobless claims corresponded with the broad bottoming in the S&P 500 in 2002-2003 followed be a decline in jobless claims and the beginning of the current bull market. I plotted jobless claims over a shorter time frame alone to include the jobless claims bottom in 2000 to November 2005 seen below.
What can be seen in the above chart is that jobless claims fell from early to mid 2003 to January 2004 at a sharp pace, but since then have been falling at a decreasing pace. With the recent news from GM and Ford mentioned above, an increase in new jobless claims could be putting in another bottom and possible reversal, bad news for the markets. Challenger, Gray & Christmas Inc., an employment consulting firm, said that the 30,000 GM job cuts combined with Fords 4,000 job cut puts the auto industry on track to meet, or possibly surpass the 2001 record of 133,686 job cuts in one year. The Challenger report said that the auto industry, which includes car manufacturers, suppliers, and auto dealers, announced 89,016 job cuts through October 2005, 123% higher than the 39,921 job cuts through October of 2004. Michael Gregory, senior economist at BMO Nesbitt Burns said that Everyone understands the old adage that Whats good for GM is good for the U.S. economy, and if GM, the bellwether, is struggling, it very clearly affects confidence. He further added that From a manufacturing standpoint, its going to have ripple effects into the parts industry as well adding to the headwind on the manufacturing side. Chief Executive John Challenger said that Job cuts will not end with these announcements. Every town with a closing plant will see its local economy take a hit. Retailers, restaurants, real estate, home improvement stores
will all see business decline. Continuing the case for a possible economic slow down comes from looking at housing starts, a reliable economic indicator. The graph below overlays the direct relationship between housing starts and the S&P 500.
As seen above, housing starts peaked in early 1999 followed by a sharp decline and advancement to a lower high seen in early 2000. This lower peak turned around into a sharp decline that foretold of the S&P 500 decline just months later. The current picture between housing starts continues to show the positive correlation between housing starts and the market. The graph below shows the 5 month housing starts average which appears to be peaking or at least leveling out, with the recent high just over 2070 units (th), the previous high.
Removing the 5 month average and plotting actual housing starts relative to the S&P 500 shows the first break in the increasing trend in housing starts where the peak occurred in February 2005 as seen in the chart below. The first lower peak in housing starts seen in April 2000 signaled the coming decline in the S&P 500. The current lower peak seen in October of this year could be telling the market what lies ahead in the near future, although a divergent pattern is seen presently with housing starts declining and the market rallying.
When looking at non-farm payrolls, new jobless claims and housing starts, all three appear to be showing weakness in the current economy and a possible declining period in the face of record oil and natural gas prices with winter knocking at our doors. These indications would also spell trouble for the stock market, and analysis of the internal strength of the market is in order. The recent highs in both the NYSE and NASDAQ have not been confirmed by their respective Adv/Dec data. The NYSE put in a new high at the current 77135.35 value but has only regained roughly half of its Adv/Dec pullback from the high seen in September, with the NASDAQ showing a higher high with an even weaker Adv/Dec move since its recent bottom.
The recent move in the Dow Jones Transport Average has not been confirmed by the Dow Jones Industrial Average. Tim Wood pointed this out in his recent wrap up on 11/11/2005, The Dow Report: Questions on Dow Theory. His graph is pasted below.
Tims thoughts on the current market and Dow Theory from his wrap up are given below: In the interim, yes, the Secondary Trend is currently bullish. But, this non-confirmation is a serious warning that the Secondary Trend is in jeopardy. Also, think about this; the Primary Trend remains bearish and the Primary sell signal according to Dow Theory still stands today. If the Dow Theory was not relevant, then why is it that this giant bear market rally separating Phase I from Phase II of the bear market has not been able to carry the Industrials to new highs? Guys, we are still at the same levels on the DJIA as we were in 1999. That was 6 years ago. If this were a new bull market dont you think we should have made a new high by now? I maintain that the advance out of the 2002 low was merely a Secondary Reaction separating Phase I from Phase II of the ongoing bear market. Furthermore, the sideways action that has been seen since January 2004 is part of the topping process associated with this giant bear market rally. His views are further supported by Frank Barbera, a frequent guest on Financial Sense News hour (click here for a link to interviews). Franks recent work looks at the current market situation and he points out that the recent advance in the S&P 500 comes on the wings of the financial stocks, as the Philly Bank Index has posted a gain of 11.18% from the low on 10/12/05 while the S&P 500 has gained 6% over the same period. This is not surprising as financials make up 20.1% of the current S&P sector weight. Frank thinks that the recent rally in the financials (and subsequently the S&P 500) appears to have been largely a rotational bet placed by large quantities of the nearly 9,000 hedge funds on a soon to be expected change in Fed Policy. He feels that, The crowd is clearly betting on the idea that Inflation for this cycle has peaked with the highs in Crude Oil and Unleaded Gasoline seen in late August, and that the Fed will soon begin to change its language toward a more accommodative stance. He goes on further to say that, In fact, it would be my view that based on the degree of conviction seen within the rally in financials over the last few weeks that the market is hoping for a change of language at the upcoming December meeting. Frank further adds, In my view, there is great risk in this assumption, in that it is far from clear whether or not we have truly seen a peak in energy pricing for this cycle, and therefore a significant decline in inflation for the Federal Reserve to go on HOLD as soon as the market is currently expecting. Were the timing of a Fed policy change delayed by several months, the repercussions for the stock market would likely not be pretty. In Franks piece he included a graph on the S&P 500 using Elliot Wave Analysis with a bearish rising wedge formation, see below.
As the NYSE and the NASDAQs recent highs have not been confirmed by their respective Adv/Dec movements, bearish divergence is also seen in the S&P 500. Looking at the weekly chart over a 3-year period with the last three highs seen in early 2004, early 2005, and the recent October high shows non-confirmation by the RSI and MACD.
Sam Stovall, chief investment strategist for Standard & Poors, took a look at the bull markets since 1942 (click here for a link to the article). The data indicates that the bull markets have averaged 56 months in length with the first years advance averaging a 38% gain followed by a 12% gain seen in the 2nd year and a 3% gain seen in the 3rd.
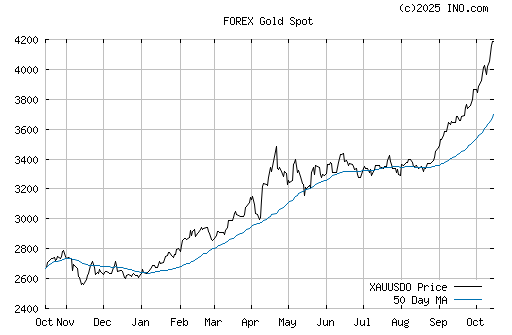
The chart above indicates that the third year poses the biggest challenge to the markets, where 6 out of the 11 (54%) bull markets over the last 60 years (including the current bull market) have finished in the red. Of those who finished the 3rd year on a positive or flat note saw an average of 14% return in the fourth year. Note that of those bull markets that survived the 3rd year on a positive note, their average return in the 3rd year was 11.8%. So how does the current bull market measure up? Taking the low as October 10th of 2002, the first year advance was 24.3% (below the 60 year average), the second year was up 8.1% (again, below the 60 year average), and the third year recently completed on October 10th of last month was up 5.8% (above the average). What I would like to point out is that the bull markets that showed a strong gain in their fourth year showed a strong return in their third. Removing the 0% return seen in the bull market that began in 1962 and the current bull market, the third year advance was 16%, 1.75 fold greater (175%) than the current bull markets 3rd year return. This observation, along with the divergence shown above in the NYSE, NASDAQ, and the S&P 500 shows the weak internal strength of the current bull market and its possible peaking. As mentioned above, Frank feels the market is expecting an easing in the Fed on interest rate hikes and has positioned itself ahead of this move as seen by the move in financials. There bet is that inflation has seen its peak in the current cycle. If investors are wrong, Frank sees a nasty reaction by the market, which could spell the end of the current bull market. As a gauge on inflation, one has only to look at how gold is doing. Does the yellow metal show signs of peaking? The simple answer is NO, and neither do gold and silver stocks as seen by the charts below.
Both the XAU and the HUI indexes have not broken through their trend lines and are even accelerating their advance as is gold, which is approaching $500! Another look at inflation would be to see how oil and natural gas are doing, which have been pushing up headline inflation. See charts below:
Both the oil and natural gas indexes have taken a hit recently but are still holding above their long term trend lines and their 200-day moving average and have even accelerated their trend this year. The current trend in natural gas and oil will likely continue due to anticipated cold weather this winter. The 30-day and 90-day weather outlook from AccuWeather given below is not encouraging (Source: AccuWeather). National 30-Day Outlook:
National 90-Day Outlook:
The Energy Department report on natural-gas storage data revealed a surprise decline in supplies of 8 billion cubic feet to 3.27 trillion cubic feet. Stocks were 32 billion cubic feet less than last year at this time, though still 195 billion cubic feet above the five-year average of 3.08 trillion cubic feet. The projected cold winter by AccuWeather will likely cause an increase in demand for natural gas and heating oil, coupled with the recent declines in natural gas storage will likely push natural gas prices further. This in turn would put pressure on headline inflation and may then cause the Fed to delay their pause in raising interest rates. This action may then cause financials and the broader markets to enter into a corrective phase. Todays Markets Index Summary Index Price Price Today's Week To Date 1 Month 10,916.09 44.66 0.4% 1.4% 6.9% 126.93 0.63 0.5% 1.5% 7.4% 2,259.98 6.42 0.3% 1.5% 8.5% 41.80 0.10 0.2% 0.8% 8.4% 4,176.08 -4.11 -0.1% 0.9% 15.2% 401.85 3.34 0.8% 1.4% 3.9% 179.27 0.56 0.3% 1.6% 8.2% Sector Summary Description Last Price Today's Week To Date 1 Month 1,259,386 -3,336 -0.3% 0.7% 7.5% 687,599 -206 0.0% 2.0% 6.5% 814,712 -1,761 -0.2% 0.9% 6.3% 813,058 8,802 1.1% 2.1% 7.1% 1,320,555 4,734 0.4% 1.1% 1.7% 2,627,074 -8,679 -0.3% 3.0% 4.1% 4,973,169 38,315 0.8% 1.7% 8.0% 2,302,937 4,081 0.2% 0.2% 3.0% 4,616,478 25,798 0.6% 1.4% 4.2% 3,164,714 17,856 0.6% 1.4% 7.4% 392,796 594 0.2% 0.7% 9.3% 880,293 5,670 0.6% 1.2% 1.3%
Chris Puplava
© 2005 Chris Puplava
Home l Broadcast l Market Monitor l Storm Watch l Sitemap l About Us l Contact Us
Copyright © James J. Puplava Financial Sense is a Registered Trademark
>

ECONOMIC AND MARKET PULSE
Source: Econoday >http://(www.econoday.com)


Source: Standard & Poors Sam Stovall


-A dip in the upper-level steering currents will develop over the Mississippi Valley during much of December, generating an active winter storm track from the southern Plains to New England. Along this track, precipitation will be near to above normal.
-South Florida and California will have above-normal temperatures during December.
-The Southeast and the Middle Atlantic regions will experience near-normal temperatures, as will a broad region of the U.S. that stretches from the Pacific Northwest, southeast to Texas.
-The region from the central and northern Plains to New England will be colder than normal during December. Much of the precipitation that falls in this region will be in the form of snow or ice.
-Higher levels of precipitation over relatively warm waters will create more lake-effect snow than usual in the Great Lakes region.
-The Pacific Northwest should have near-normal precipitation in December, but the remainder of the western states, as well as the Rockies and the western Plains, will likely have below-normal precipitation
-December through February will be colder than normal over the eastern third of the nation. The only exception will be South Florida, which will experience near-normal temperatures.
-Much of the western half of the nation will be warmer than normal during the next 90 days, but Utah, southern Idaho and Nevada will experience near-normal temperatures.
-Precipitation will be above normal from the eastern Great Lakes to northern New England, and near normal from southern New England and the Middle Atlantic region to the central Gulf Coast.
-The Southeast coast will be drier than normal in the 90-day period, as will much of the western United States. Only the region from the Pacific Northwest to western Montana will have near-normal precipitation.
-This winter will likely be quite snowy from the Great Lakes to New England, where temperatures will be below normal and precipitation near to above normal.
-A developing drought in the southern Plains is likely to worsen this winter.
Change
% Price
Change
% Price
Change
% Price
Change
Price
Change
% Price
Change
% Price
Change
% Price
Change
Puplava Financial Services, Inc.
Email
![]()
P. O. Box 503147 San Diego, CA 92150-3147 USA 858.487.3939
The material on this website has no regard to the specific investment objectives, financial situation, or particular needs of any visitor. It is published solely for informational purposes and is not to be construed as a solicitation or an offer to buy or sell any securities or related financial instruments. References made to third parties are based on information obtained from sources believed to be reliable but are not guaranteed as being accurate. Visitors should not regard it as a substitute for the exercise of their own judgment. Any opinions expressed in this site are subject to change without notice and Financial Sense is not under any obligation to update or keep current the information contained herein. PFS Group and its respective officers and associates or clients may have an interest in the securities or derivatives of any entities referred to in this material. In addition, PFS Group may make purchases and/or sales as principal or agent. PFS Group accepts no liability whatsoever for any loss or damage of any kind arising out of the use of all or any part of this material. Our comments are an expression of opinion. While we believe our statements to be true, they always depend on the reliability of our own credible sources. We recommend that you consult with a licensed, qualified investment advisor before making any investment decisions. DISCLAIMER
Poster Comment:
Alright, fellow doomers and malcontents...come and get it! Sorry for this being so late, but my ISP was down most of the night.
Subscribe to *unUsual Suspects*
Post Comment Private Reply Ignore Thread
Top • Page Up • Full Thread • Page Down • Bottom/Latest
Comments (1-16) not displayed.
.
.
.
#17. To: DeaconBenjamin (#11)
Did you make a handsome profit?
The latest from Don Coxe -- Link to the Don Coxe Conference Call Richard W.
Don Coxe is saying that there is no inflation and the increase in the price of gold is all being driven by incresed demand for jewelry. He may be right or he may be wrong. Because Coxe has been going out of his way to inject right wing politics into his comments, I view his conclusions with the same degree of skepticism as I do anything that Larry Krudlow might say. Coxe isn't even making an attempt at appearing objective lately which is too bad because he used to make a lot of sense. Now his comments have taken on a character of more wishful fanasty economics and spin than dealing with the facts as they are. He is completely dismissive of the notion that increases in the price of gold may be related to currency debasement. Richard W.
Certainly not. I haven't sold any for years. Could I make a handsome profit? You betcha.
New motto: Buy gold. 100 million Chinese can't all be wrong.
Inflate or die -- "Given the unique and dangerous situation we are in (enormous debt and high leverage, skyrocketing energy costs, bleak western economy) why has the market since 2004 traded as if we are in a period of low risk, cautious but sustained optimism? I present my hypothesis." A PERPETUAL BULL'S ANALYSIS OF THIS MARKET Richard W.
"As the Fed continues its inflation campaign, most have yet to come to grips with the reality of America’s uniquely precarious situation. In an act of prestidigitation that would impress Harry Houdini, the Fed is now attempting to hide evidence of the most inflationary monetary policy in its history by no longer publishing data on the growth of M3, while mystifying the public with phony CPI statistics. However, the relentless rise in the price of gold is evidence that fewer people are being fooled by the Fed’s slight of hand." "Gold’s recent rise to just under $500 per ounce, gaining over $30 per ounce in November alone, indicates the market's expectation of both higher current inflation and increased expectations for future inflation. Higher long-term interest rates are sure to follow. As fiat currencies continue to lose value relative to gold, lenders world-wide will demand higher rates of return to compensate for that loss, ending the low interest rate environment that has nourished the global economy for the past six years." Richard W.
"Anyone looking at the stagnant job offering data, the weakening of the housing and mortgage financing sector would concur that all's not well with our economy. But, for the time being, stock market investors are thankful for that. This is the good news that the market has been thriving on. The bad news for the 30,000 GM workers that are getting laid off, for example, spells relief of the inflationary pressure, which is good news for the financial market. Unfortunately, sometimes what's good for Wall Street may be bad for Main Street. But it's only a matter of time before what's bad for Main Street is also bad for Wall Street." Richard W.
From John Williams via Doug Gillespie -- "Unilaterally and without reasonable explanation, the Fed has decided to stop reporting money supply M3, the broadest of the monetary aggregates and probably the most important statistic published by the U.S. central bank. The decision comes as a shock to many in the financial community and apparently to other central banks, which reportedly were not consulted." "One obvious explanation that makes sense is that the Fed does not want anyone to see what Presumptive Fed Chairman Ben Bernanke is going to do to broad money growth. Suggestions that Mr. Bernanke has the odor of an inflationist about him are not going to help quell the speculation. Something is terribly afoul at the Fed, but the popular financial press offers little but moronic platitudes and attacks on "conspiracy theorists" who dare to question the sanctity of the Federal Reserve Board." Fed Abandons M3 Without An Honest Explanation Richard W.
John Mauldin has really warmed up to the idea that the world is going to endlessly pay us to buy their stuff and shuffle paper. A brave new world where we can live high by not really producing anything of value. Ha! "And it is an idea to which I subscribe, though for different reasons. It will not just be the pressure from platform companies wanting to avoid taxes that will precipitate that change. I would make the argument that the current generation (in nearly every country in the developed world) and our forebears have written a check in the names of our children which they will not be able to pay. By this I mean our social security and pension programs. And if they cannot pay it, they won't. The social contract between generations and governments is going to be re-written in the next 20 years." "We live in interesting times." "Next week: Empire of Debt, The Rise of an Epic Financial Crisis." Our Brave New World, Part Two by John Mauldin Richard W.
I can see why it is important for the rightwing true belivers like Coxe to try to downplay the importance of the abandonment of M3 reporting and the rise in gold. Richard W.
Hello Richard. Good having you back again. As we all on this planet now experience economic and monetary truth rearing its head, we will continue to see who has the ability to confront the lies and falsities. Will one's emotion and/or philosophy get in the way and will one then not understand and see what is truly rolling forth before our eyes and our futures. The following chart makes it abundantly clear what's happening but only Adam Hamilton is mentioning it and only in its context of phase 2 for the gold bull. Keep in mind that this is a planet wide phenomenon, not just a US monetary or economic event. After all, we are talking about the 'reserve currency' for the planet vs that one item that has always been cherished and stood for wealth. Courtesy of P. da Wit Keep in mind. There is no black magic here. This is not a 'VooDoo Chart'. This is pure unadulterated TRUTH! The implications are simple and maybe ominious should one not heed the truth pictured in this chart. They laughed at Noah and they laughed at the true believers in gold. Choose your path while there is still time. REPENT! and follow the ways of life given to us by the wise and the Prophets not the enslavers, the users, the evil tyrants and despots.
I'll be posting that religious side of things on Sunday evening.
The people who say that PM's are rising due to a tight marginal supply and demand for jewelry are correct. I myself have helped contribute to the tight marginal supply of silver by hording "junk" silver that ought to be turned in to the authorities and melted down. I have also contributed to the demand for jewelry particularly 100 year-old round pieces of jewelry. The chain to hang it around my neck is optional. My main motivations are from looking at my bank loaning scads of money to people buying overpriced real estate and secondarily from the transactions of our so-called economy visible inside trucks carrying stuff that I wouldn't want (apart from a spare battery for my laptop perhaps) and electronic commerce containing items of even less value - poorly organized information and buggy software for example. Is there anyone out there creating items of lasting value like fine furniture or restoration of an old car? If so, congratulations, you are in the distinct minority.
Money problems do not come from a lack of money, but from living an excessive, unrealistic lifestyle
"Given the unique and dangerous situation we are in (enormous debt and high leverage, skyrocketing energy costs, bleak western economy) why has the market since 2004 traded as if we are in a period of low risk, cautious but sustained optimism? I present my hypothesis." I think this analysis is right on. Da Boyz all over the world are pumping money into the U.S. Dollar and the U.S. stock markets and bond markets, and the banksters are up-to-thier-eyeballs in housing market-related debt. And all of it's leveraged by the massive derivatives market. They're all frozen into place. It's the calm before the perfect storm. The fly in the ointment is that the good jobs have gone and are going overseas, and the new "good jobs" have all been housing construction related. Now the white hot housing market is flattening/cooling/declining, Toll Bothers is showing weakness and that fly is flailing. It's going to hit the fan when, contract by contract, the over- leveraged consumer walks away from his unpayable mortgage IMO. The "smart money" has begun to bail into gold and the bell is ringing. Da Boyz may or may not hammer it down. Hope they do cause I wanna buy some more.
... and welcome back!
Did you read the Mauldin article? Politically, he's pretty much part of the same rightwing political fringe as Coxe. I find it very interesting that Mauldin is trying to run off copper speculators while raising questions about the "meaning" of coppers rise. Both Coxe and Mauldin are telling us to ignore the inflationary implications so I guess they both got the same talking points. It is amuzing that last year, Coxe was trying to spin copper prices by saying that there were hidden warehouses full of copper which could be dumped into the market at any time. The message seems to be that if prices can't be controlled, then tell everyone that the price is meaningless. Politics has infected and corrupted everything. Richard W.
The most massive Ponzi Scheme the world has ever seen -- interesting times a' comin' ...
Yeah, you are buying "potential" jewelry. Everyone knows that gold and silver aren't "real" money. Only government issued ponzi scheme paper IOU's are money. Ha! Richard W.
Thanks, it's good to be back. Richard W.
Black Friday Sales Flat as Holiday Shopping Season Begins
What is most interesting to me is the merging of science fiction with economic fiction. There's a revolution coming in the next few decades merging machine intelligence into man's intelligence creating the unimaginable productivity improvements. Meanwhile I am stocking up on silver and split wood. I'm off to the flea market now...
Money problems do not come from a lack of money, but from living an excessive, unrealistic lifestyle
I watched about an hour of "news" Friday on CNN. I couldn't handle anymore than that. It was all media hype about shopping. They actually had reporters stationed at various malls. The obvously staged WalMart wrestling match between a customer and "security" just coincidently "caught" on video and immediately delivered to CNN pretty much put me over the top. The key hot button words this year were "excitement" and "enthusiasm". Have to wonder how bad things are going to have to get to bring people back to their senses. My key words for this years black Friday are "madness" and "stupidity". Richard W.
Just back from the flea market, relatively busy for this late in the year. There were at least 5 vendors with coins and rounds and more with silver stuff. The gold coin seller was there with his at least 15k of gold coins. I bought about $150 worth of morgan and peace dollars from him and one other dealer plus 5 more eagles at $11. I figure the eagles make good gifts. There were no buyers in the 100's like previous weeks but there were buyers and a few newbies asking about silver and coins in general. I didn't see anybody wrestling over any merchandise.
Money problems do not come from a lack of money, but from living an excessive, unrealistic lifestyle
This current period calls for having your eyes wide open, throwing away all current and past concepts and rules that are not pure and fundamental like; 2+2=4. Then apply those base fundamentals and see what you come up with. That's qutie a task, especially for one who has been in the business of finance and economics and has made a living by using and extolling those concepts that they have honed over the years. 'If it doesn't work, fix it !' But that is oh so hard to trash everything you have worked for all of your life and start over. This sea change that we are witnessing is truly going to be BIBLICAL.
A little early but I have the chart finished and it'll be good to look at it and get an idea of what's in store for this coming week. The VooDoo Chart follows. Courtesy of P. da Wit I have trimmed the FIBO lines further. It takes more than one go or the first go at it to get it right. There is a degree of art in it. I don't just put up FIBO lines that start at the nearest top or bottom. FIBO lines detail a growth cycle, not the interim ups and downs of daily or weekly trading. I do use interim FIBO lines between major growth points however and only those major growth points of 0%, 50% and 100%. So here it is and it looks like we are nearing the point of truth, $500 gold. So far the action has really shown no reluctance to address that plateau. The last lime line has now been runing for 3 weeks, a first since the start at June 01. This lime line was put in on the 9th of Nov and has not been changed. It has shown itself to be a true major thrust of gold. It had one break on the 14th of Nov but reacted violently and regained its trend. Currently the the price is above the FIBO line at 38.2%/$494 on its way to $520 and below the 61.8%/ $499 line which is the growth from $485.89 to $520. Interesting juncture, it's the last leg from $451 to $520 and in the smaller set of FIBOs, the first leg of $485 to $520. This will make for some interesting action. Will gold blow past $500 on its way to $520, take a pause and before making up its mind or has its mind been made up and it'll blow right thru $499 on its way to $520. In the scheme of FIBO lines, $500 is not a factor, only in men's minds. $494 and $499 are going to be the key prices that will tell us there is more growth coming in the short term. Like everyone is saying $500 is a psychological level. Follow the chart and let's see which will rule the trend, the mindset or the fundamentals. Don't forget $500 is only an American phenomenon. On this basis I see gold continuing onward and upward. Also keep in mind that the CRIMEX is no longer the big player. If you look at the 24hr spot price you'll notice that the action is in London and has been for several months now. Remember, the VooDoo Chart is you friend and has demonstrated that for over a year now, perfectly detailing the trends and inflection points. Especially last week when everyone was going gu gu ga ga over asymptocity. It is different this time and the VooDoo Chart without error has pointed the way.
Forgot to mention the RSI and MACD. RSI is in overbought territory and has been for over a week. Overbought has not shown itself to be the same turning point as in the past so I wouldn't put as much value in it now as in the past. MACD has not turned and is still streaking upwards. All in all with the FIBO lines, an intersting juncture.
"Natural gas is really fascinating stuff on many levels. It is primarily methane, the lightest hydrocarbon molecule. It is burned to drive turbines in electrical-power-generation plants, to heat homes and businesses across the nation, and as a feedstock to produce the agricultural fertilizer ammonia. It is one of the most important economic commodities in the US today after crude oil." "Thus, for many years to come in the States, natural-gas demand growth will exceed supply growth keeping US gas prices high. As investors and speculators, this structural deficit creates a marvelous fundamental opportunity for us to profit. The elite gas companies that are drilling, pumping, and transporting the scarce gas to market are in an amazing position to reap legendary gains for years." Richard W.
National Association of Realtors' chief economist David Lereah is concerned enough about the proliferation of so-called "exotic" mortgages that he has gotten the government to consider a limit on them. By exotic mortgages, Lereah means interest-only and option adjustable-rate products, which are being used by many first-time buyers, among others, to purchase houses in high-priced markets. In the first six months of the year, demand for alternative adjustable-rate mortgages, also known as Alt-A or option ARMs, and interest-only mortgages increased as the difference in interest rates for standard ARMs and fixed-rate mortgages narrowed, said Doug Duncan, chief economist for the Mortgage Bankers Association of America in Washington. The share of first-mortgage originations that were interest-only loans rose to 23 percent from 17 percent during the same period last year, and the Alt-A share increased to 11 percent from 8 percent. Those are national numbers, however. The problem Lereah has is with the highest-priced markets, such as California, where the percentages of interest-only and Alt-As are much higher and people in need of affordable housing "are stretching their credit to the limit." "The markets with a high percentage of these loans are more fragile to shocks such as rising interest rates," Lereah said last month during the Realtors' convention in San Francisco. Lereah went to the Office of the Comptroller of the Currency, which oversees the nation's banks, "to talk about the behavior of lenders who are offering these exotic mortgages." "I'd like to see more guidelines on the percentage of these loans that can be issued, even if it slows home sales, to ensure a soft landing for the market," he said. He found that he and the comptroller, John C. Dugan, were on the same page. New guidelines on nontraditional loans are due Jan. 1, Lereah said.
WHY does the European Central Bank want to raise interest rates? Every European government says it shouldn’t. The International Monetary Fund and the European Commission say it shouldn’t. The Fed and the Bank of England say, privately, that it shouldn’t. And the economic statistics certainly say that it shouldn’t. Yet Jean-Claude Trichet, the ECB President, has more or less announced that eurozone interest rates will rise this week. Does this mean that M Trichet “knows something” that nobody else understands about the condition of Europe? Or is it that M Trichet does not know something that everyone else understands very well? For example, that economic policy has progressed a long way since the Bundesbank’s pre-Keynesian sado-monetarism. Or that a central bank’s credibility now depends on sustaining demand, as well as controlling inflation. Or that supply-side reform is politically impossible and economically counter-productive in the absence of pro-active management of demand. Or simply that, when you’re stuck in a hole, the first thing to do is to stop digging.
"Americans are expected to buy the products without having the incomes associated with their production. ... Outsourcing Economy Far Greater Threat Than Terrorism to U.S.
Gold -- Richard W.
Hey, hey, hey. Another posting fiend.
Must be all those newly rich Asians buying jewelry and the Russians buying gold. Can't have anything to do with inflation or the debasement of the dollar. Richard W.
Yeah, right. I've got this crazy feeling that $500 is going to be taken out by streaking line and then it's going to be a critical mass chain reaction after that. I didn't expect $499 to be approached so vigorously but I did expect it to be approached with some intrepidation and consolidation. That still may be the case but it doesn't look like it the way Asia is going.
GG is the top HUI gainer at 158%, 100% being its starting point. Volume in miners stocks continues to grow continuously for the 8th week in a row.
Gold shy of $500 in Asia as Japan buys, PGM rises By Lewa Pardomuan and Chikafumi Hodo SINGAPORE/TOKYO, Nov 28 (Reuters) - Gold hit an 18-year high above $498 an ounce in volatile Asian trade on Monday as fund buying resumed in Japan, but profit taking crimped any test of the $500 level. In platinum group metals, spot platinum hit its highest level since March 1980 at $996 an ounce, aided by gains in Tokyo where platinum futures hit a new record high. Spot gold rose to $498.75 an ounce -- its highest since Dec. 14, 1987, when it also briefly topped $500 -- before easing to $497.40/497.90 in late afternoon trade. The metal was last quoted at $495.50/496.30 an ounce in London on Friday. "I'm reluctant to buy at these levels. It's more because there are not enough players in the market at this point of time. But we see a continuous upward trend," said one dealer in Singapore. "I guess $500 is only a psychological level. Nothing will interest me until gold reaches $510," he said. Gold held above $500 for just one day in December 1987, while in early February 1983 it managed a few attempts, peaking at $509 before falling to around $340 by the end of that year. It hit a record high of $873 an ounce in January 1980. The main October gold contract on the Tokyo Commodity Exchange rose to 1,962 yen per gram, its highest since Aug. 1990, as a fall in the yen to its lowest in two years against the dollar sparked fund buying. Japanese investors are eagerly diversifying their assets into precious metals as an alternative to stocks, bonds and currencies to boost returns. A lower yen raises the value of yen-based gold and other commodities prices. "Investors really don't want to take profits until they see spot gold rise above $500," said Koji Suzuki, market analyst at Livedoor Commodity Ltd. "Prices will remain strong but we want to see whether it can extend gains when New York players return to the market today," he said. The U.S. market reopens later on Monday after last week's Thanksgiving holiday. Dealers said fund managers were keen to push gold above $500 as worries about inflation and geopolitics grow. But high prices have also crimped demand in Asia, especially in main consumer India. "Despite this, there is a positive feeling in the market that gold will test the key level, but it is likely to stall on the way as traders cash in on profits," said N M Rothschild in a daily report. ZERO PREMIUMS The physical sector suffered a lack of buying interest from jewellers because of soaring prices, which cut premiums for gold bars in key bullion trading centres of Hong Kong, Singapore and Tokyo. In Tokyo, premiums for gold bars fell to zero, compared with 25 U.S. cents an ounce to the spot London price two weeks ago, as investors cashed in their holdings. But dealers in Japan said gold would be well supported at lower levels. "Considering this extremely bullish condition, we should be seeing some profit-taking. But falls in gold will be limited as there are plenty of investors waiting to buy on dips," Livedoor's Suzuki said. Other precious metals tracked gold's gains, with silver rising to its highest since April 2004 at $8.26. It was later quoted at $8.25/8.28 an ounce in afternoon trade, up from $8.18/8.20 late in London. Platinum rose to $993/997 an ounce from $986/990. Sister metal palladium also rose to $259/263 from ounce from $257/261 late in London.
Yes it's going to go up, yes it's going to go down. What gobbledegook.
Comments (58 - 79) not displayed.
Top • Page Up • Full Thread • Page Down • Bottom/Latest
#18. To: All (#14)
#19. To: All (#18)
#20. To: A K A Stone (#17)
Did you make a handsome profit?
#21. To: Arete (#19)
the increase in the price of gold is all being driven by incresed demand for jewelry.
#22. To: All (#19)
#23. To: DeaconBenjamin (#21)
#24. To: All (#23)
#25. To: All (#24)
#26. To: All (#25)
#27. To: All (#26)
#28. To: Arete (#27)
... to try to downplay the importance of the abandonment of M3 reporting and the rise in gold.

#29. To: All (#28)
This is not a 'VooDoo Chart'.
#30. To: All (#28)
This chart wraps up all that is/was considered money.

#31. To: Arete (#23)
However, the relentless rise in the price of gold is evidence that fewer people are being fooled by the Fed's slight of hand.
#32. To: Arete, All (#22)
Inflate or die --
#33. To: Arete (#27)
#34. To: imawit (#28)
As we all on this planet now experience economic and monetary truth rearing its head, we will continue to see who has the ability to confront the lies and falsities.
#35. To: purpleman (#31)
Is there anyone out there creating items of lasting value like fine furniture or restoration of an old car? If so, congratulations, you are in the distinct minority.
#36. To: purpleman (#31)
I myself have helped contribute to the tight marginal supply of silver by hording "junk" silver that ought to be turned in to the authorities and melted down.
#37. To: Phaedrus (#33)
... and welcome back!
#38. To: Arete, All (#37)
#39. To: Phaedrus (#35)
interesting times a' comin'
#40. To: Phaedrus (#38)
#41. To: Arete, Phaedrus (#40)
WalMart wrestling match
#42. To: Arete (#34)
The message seems to be that if prices can't be controlled, then tell everyone that the price is meaningless. Politics has infected and corrupted everything.
#43. To: All (#29)
I'll be posting that religious side of things on Sunday evening.

#44. To: All (#43)
...VooDoo Chart is you friend...
#45. To: All (#40)
#46. To: Arete (#45)
#47. To: All (#46)
#48. To: Arete, All (#45)
#49. To: All (#45)
#50. To: Arete (#49)
checkout silver too !
#51. To: imawit, arete (#50)
How did I do?
#52. To: DeaconBenjamin (#51)
How did I do?
#53. To: DeaconBenjamin, imawit (#51)
#54. To: Arete (#53)
Can't have anything to do with inflation or the debasement of the dollar.
#55. To: Arete (#53)
for the year ...
#56. To: Arete (#53)
Gold up, Dollar up.
Monday 28 November 2005, 1:02am EST
#57. To: DeaconBenjamin (#56)
Gold up, Dollar up.
.
.
.