See other World News Articles
Title: Momentum Death Cross Taking Place…
Source:
[None]
URL Source: https://www.investmentwatchblog.com ... ntum-death-cross-taking-place/
Published: Mar 14, 2022
Author: staff
Post Date: 2022-03-14 14:03:23 by Horse
Keywords: None
Views: 192
Comments: 1
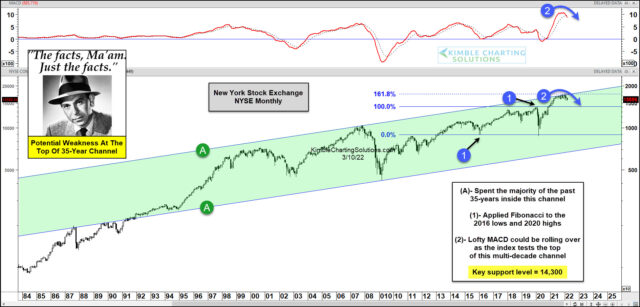
As you can see, the NYSE spent the past 35 years in a rising trend channel marked by each (A). And more recently, price reached the top of that channel (resistance) and began to turn lower. See also Momentum with GOP... But this area turned out to be more than just channel resistance… it’s a major 1.618 applied Fibonacci extension level as well (when using 2016 lows and 2020 highs). And as the NYSE price hit this 1.618 Fibonacci level, the MACD (momentum) indicator hit some of its loftiest readings on record… and began to turn lower. So with price and momentum turning lower from the top of a 35-year channel, it’s probably wise for investors to stay tuned! 
Post Comment Private Reply Ignore Thread
Top • Page Up • Full Thread • Page Down • Bottom/Latest
#1. To: Horse (#0)
Those last 2 words are a real twist. It would be fitting for it to have a "..." placed before them. "This is really important but we don't know what it means you should do as we're still trying to figure that out!"
it’s probably wise for investors to stay tuned!
Top • Page Up • Full Thread • Page Down • Bottom/Latest