See other World News Articles
Title: Silver Scarcity Gets More Extreme
Source:
[None]
URL Source: https://www.zerohedge.com/news/2022 ... ver-scarcity-gets-more-extreme
Published: Sep 3, 2022
Author: Tyler Durden
Post Date: 2022-09-03 07:17:54 by Horse
Keywords: None
Views: 303
Comments: 6
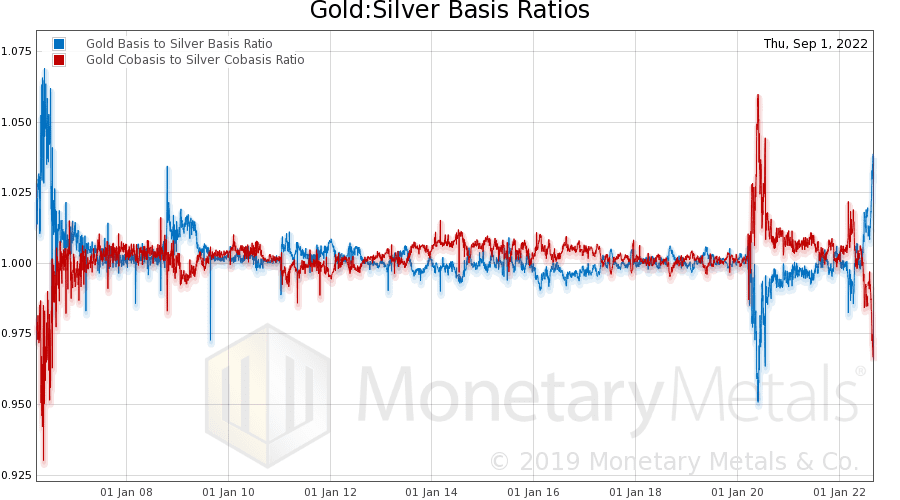
By Keith Weiner Since our last silver article, the price of silver has dropped. With due respect to Frederic Bastiat, the price is the seen. The basis mostly goes unseen. We will take a look at the market data, revised for a few more days of trading. Warren Buffett, 2008, and the Cobasis But first, let’s look at a chart we have discussed a few times over the years. It shows two ratios: gold basis to silver basis, and gold cobasis to silver cobasis. It shows a measure of gold’s abundance to silver’s abundance, and gold’s scarcity to silver’s scarcity. When the blue line is above 1, it means the gold basis is higher, which means gold is more abundant. When the red line is below, it means gold is less scarce. Gold and Silver Basis Ratio The blue line is not merely above 1. It is now above the spike in Oct, 2008. To find a level this high, we have to look as far back as 2006. In other words, 16 years. Before that, 2001. And before that, 1998, when Warren Buffett’s Berkshire Hathaway was buying mass quantities of silver—after he drove the price up 73% from about $4.25. 
Post Comment Private Reply Ignore Thread
Top • Page Up • Full Thread • Page Down • Bottom/Latest
Begin Trace Mode for Comment # 5.
#3. To: Horse (#0)
If it's so scarce, why is the price <$18/oz?
It's going to go straight up tomorrow. But tomorrow never comes.
There are no replies to Comment # 5. End Trace Mode for Comment # 5.
Top • Page Up • Full Thread • Page Down • Bottom/Latest
#5. To: Lod (#3)
Replies to Comment # 5.