See other National News Articles
Title: How America's Poverty Rates Differ By Race
Source:
[None]
URL Source: https://www.zerohedge.com/personal- ... icas-poverty-rates-differ-race
Published: Oct 14, 2024
Author: Tyler Durden
Post Date: 2024-10-14 10:13:39 by Horse
Keywords: None
Views: 46
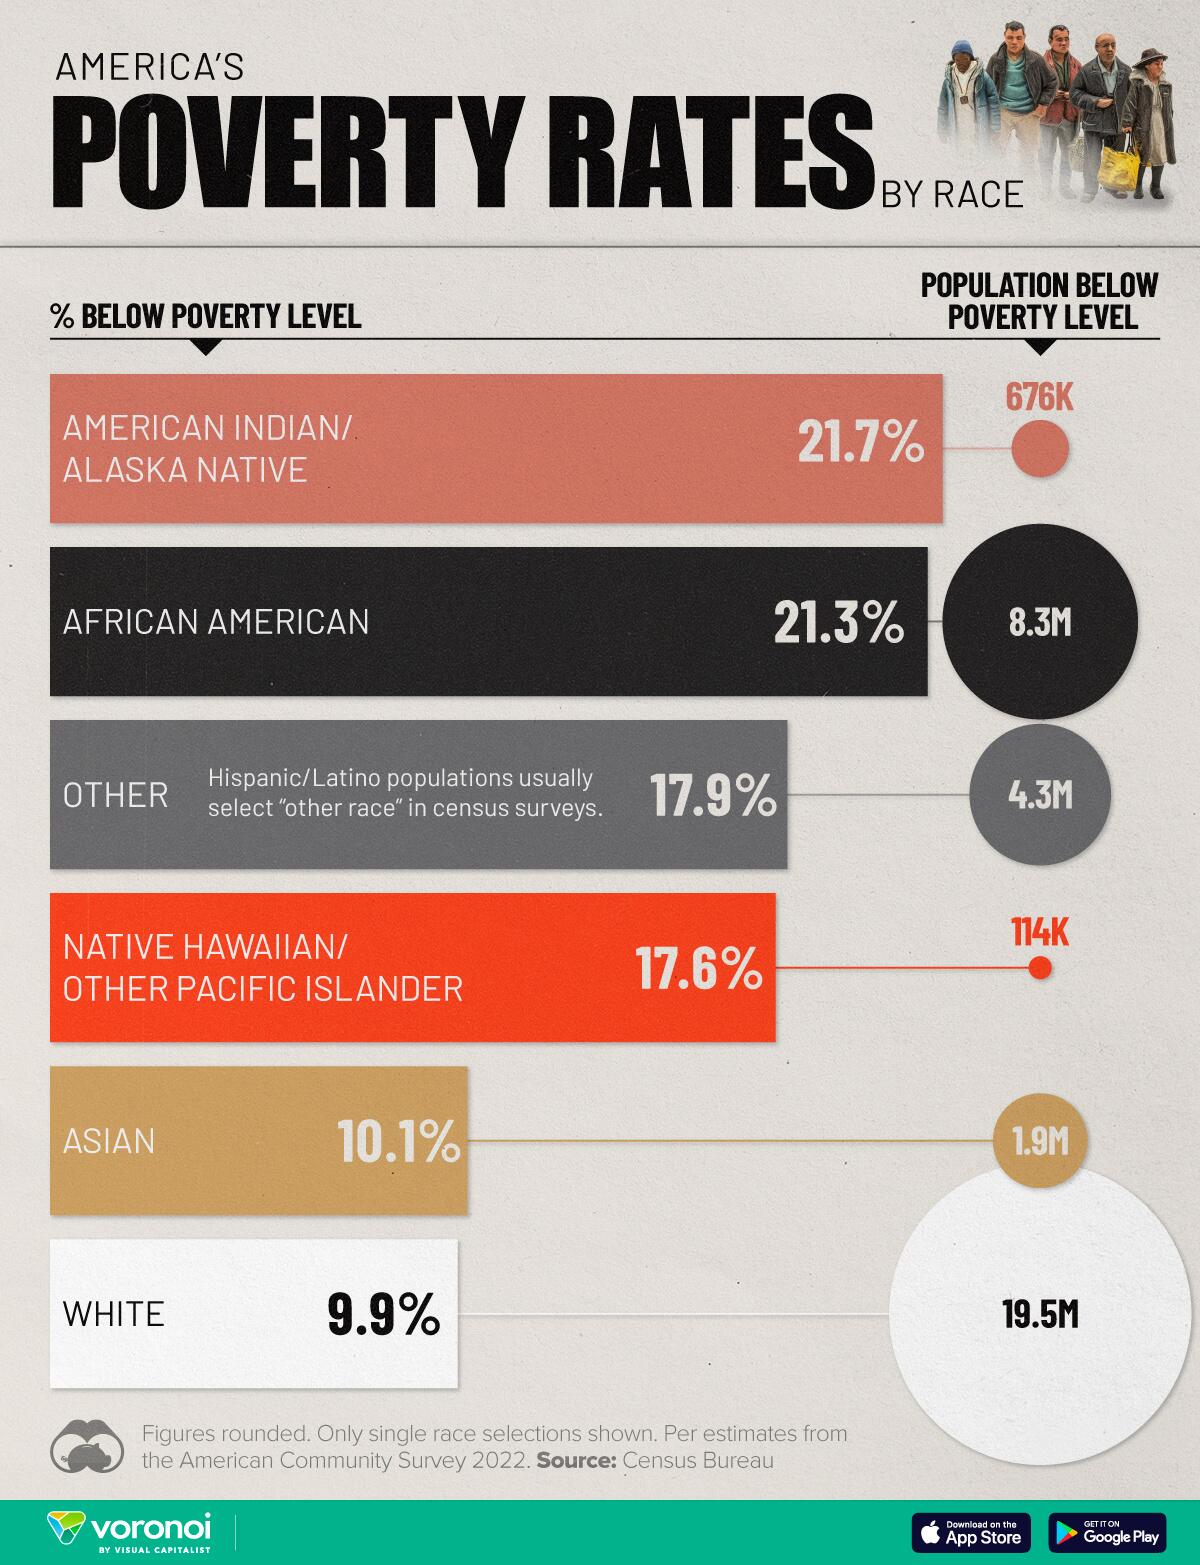
The U.S. poverty rate stands at 12%, affecting about 41 million people across the country. At the state level, this rate ranges from 7% to 18%, depending on local economic conditions. But how does poverty differ when examined through the lens of racial demographics? This chart, via Visual Capitalist's Pallavi Rao, visualizes the percentage and number of Americans living below the poverty threshold, categorized by race, based on data from the American Community Survey 2022 conducted by the Census Bureau. It focuses on respondents who selected a single race. 
Post Comment Private Reply Ignore Thread