See other National News Articles
Title: This Is The Income A Family Needs To Be Middle Class, By State
Source:
[None]
URL Source: https://www.zerohedge.com/personal- ... ly-needs-be-middle-class-state
Published: Jul 5, 2025
Author: Tyler Durden
Post Date: 2025-07-05 20:02:42 by Horse
Keywords: None
Views: 23
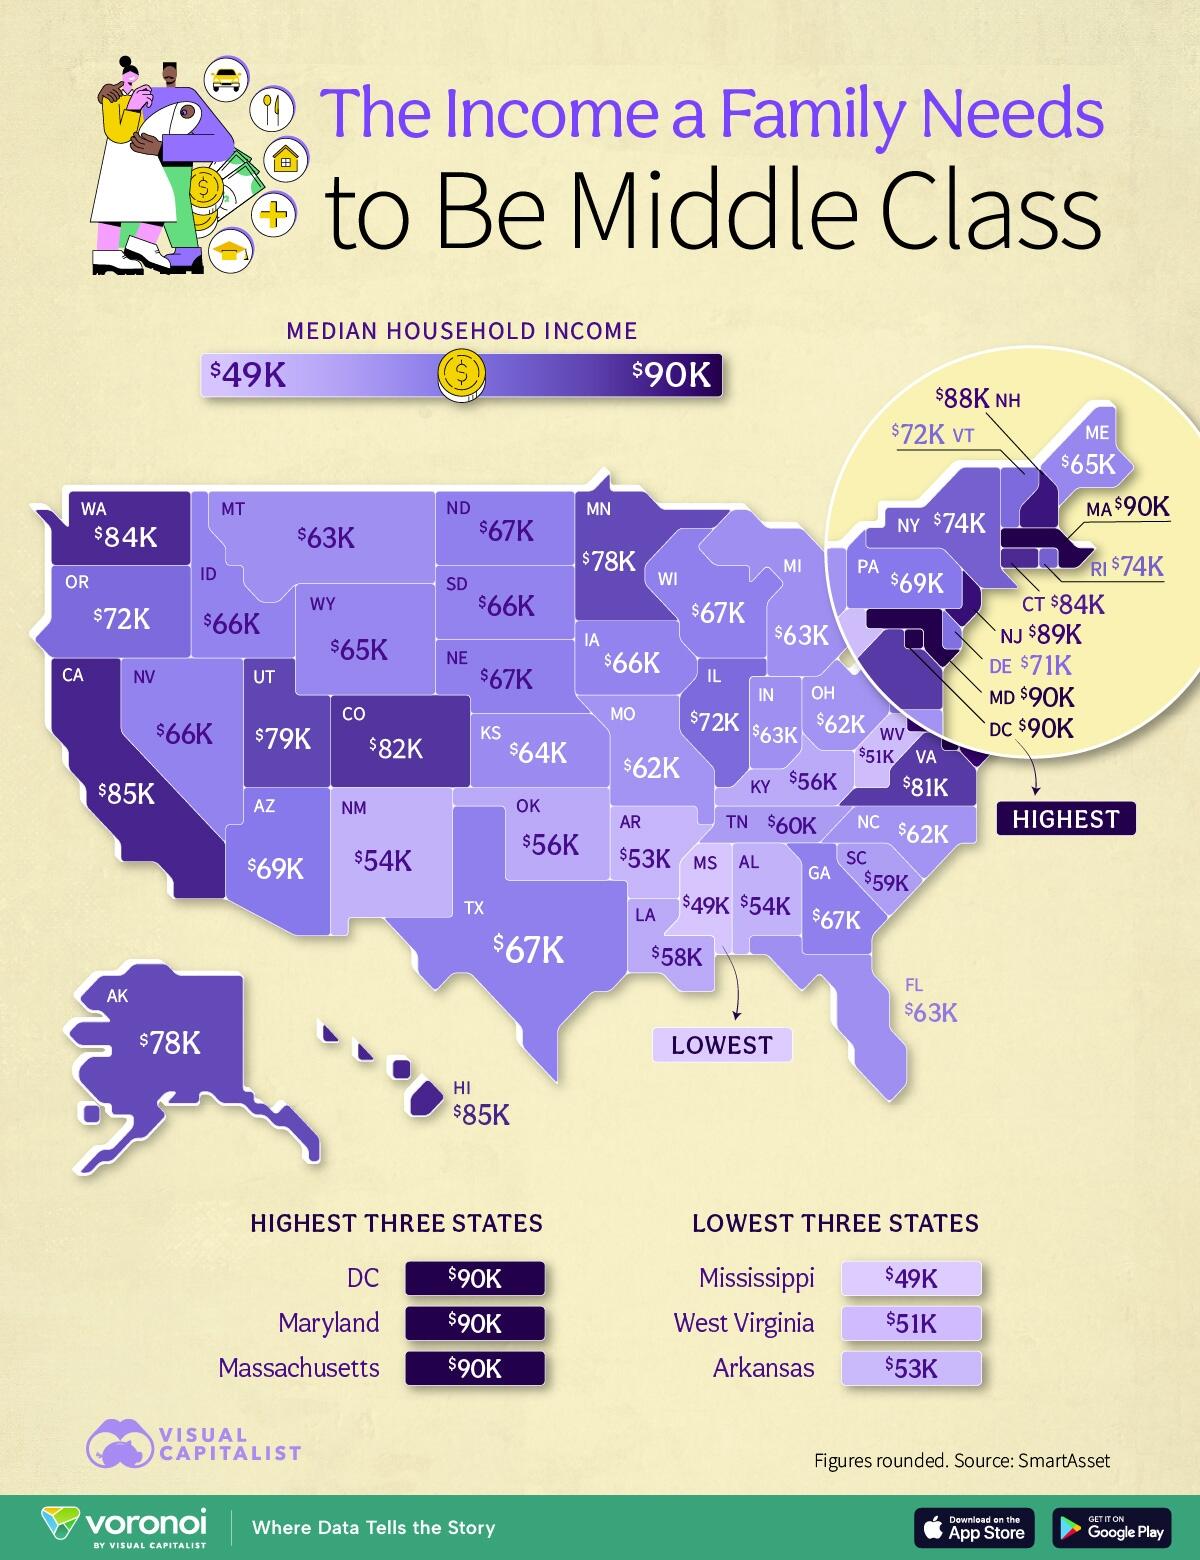
Across the United States, what qualifies as “middle class” varies widely depending on where you live. This map, via Visual Capitalist's Bruno Venditti, breaks down the median household income for each U.S. state, revealing sharp contrasts in earning power. It provides a snapshot of where families may feel more or less financially secure based on local income benchmarks. Editor’s note: This map uses median household income as a simple indicator of the middle class in each state. True middle class status typically spans a range of incomes. Top Earners Cluster in the Northeast Maryland, Washington D.C., and Massachusetts lead the nation with household incomes at or above $90,000. High concentrations of federal jobs, tech firms, and elite educational institutions contribute to these numbers. According to Pew Research Center, these regions also report strong access to health care and education, reinforcing higher cost-of- living dynamics. (TN is 40th at $59,862) The South Continues to Lag Behind Southern states like Mississippi, and Alabama have the lowest median household incomes, under $54,000. Economic mobility in these regions is often hindered by lower investment in public infrastructure and education. As Brookings notes, many Southern states also experience higher poverty rates and limited access to high-paying industries. States with Growing Incomes Several states in the West and Midwest—including Oregon, and Utah—are emerging with stronger income levels, typically in the $70,000-$80,000 range. Poster Comment: Chart at source with exact state values does not copy.
Post Comment Private Reply Ignore Thread