See other Science/Tech Articles
Title: CHAPTER 7: Introduction to the Atmosphere - Causes of Climate Change
Source:
http://www.physicalgeography.net/
URL Source: http://www.physicalgeography.net/fundamentals/7y.html
Published: Feb 25, 2008
Author: michael.pidwirny@ubc.ca
Post Date: 2008-02-25 22:03:19 by robin
Keywords: None
Views: 909
Comments: 25
CHAPTER 7: Introduction to the Atmosphere Causes of Climate Change Figure 7y-1 illustrates the basic components that influence the state of the Earth's climatic system. Changes in the state of this system can occur externally (from extraterrestrial systems) or internally (from ocean, atmosphere and land systems) through any one of the described components. For example, an external change may involve a variation in the Sun's output which would externally vary the amount of solar radiation received by the Earth's atmosphere and surface. Internal variations in the Earth's climatic system may be caused by changes in the concentrations of atmospheric gases, mountain building, volcanic activity, and changes in surface or atmospheric albedo. Figure 7y-1: Factors that influence the Earth's climate. The work of climatologists has found evidence to suggest that only a limited number of factors are primarily responsible for most of the past episodes of climate change on the Earth. These factors include: Variations in the Earth's Orbital Characteristics The Milankovitch theory suggests that normal cyclical variations in three of the Earth's orbital characteristics is probably responsible for some past climatic change. The basic idea behind this theory assumes that over time these three cyclic events vary the amount of solar radiation that is received on the Earth's surface. The first cyclical variation, known as eccentricity, controls the shape of the Earth's orbit around the Sun. The orbit gradually changes from being elliptical to being nearly circular and then back to elliptical in a period of about 100,000 years. The greater the eccentricity of the orbit (i.e., the more elliptical it is), the greater the variation in solar energy received at the top of the atmosphere between the Earth's closest (perihelion) and farthest (aphelion) approach to the Sun. Currently, the Earth is experiencing a period of low eccentricity. The difference in the Earth's distance from the Sun between perihelion and aphelion (which is only about 3%) is responsible for approximately a 7% variation in the amount of solar energy received at the top of the atmosphere. When the difference in this distance is at its maximum (9%), the difference in solar energy received is about 20%. The second cyclical variation results from the fact that, as the Earth rotates on its polar axis, it wobbles like a spinning top changing the orbital timing of the equinoxes and solstices (see Figure 7y-2 below). This effect is known as the precession of the equinox. The precession of the equinox has a cycle of approximately 26,000 years. According to illustration A, the Earth is closer to the Sun in January (perihelion) and farther away in July (aphelion) at the present time. Because of precession, the reverse will be true in 13,000 years and the Earth will then be closer to the Sun in July (illustration B). This means, of course, that if everything else remains constant, 13,000 years from now seasonal variations in the Northern Hemisphere should be greater than at present (colder winters and warmer summers) because of the closer proximity of the Earth to the Sun. The third cyclical variation is related to the changes in the tilt (obliquity) of the Earth's axis of rotation over a 41,000 year period. During the 41,000 year cycle the tilt can deviate from approximately 22.5 to 24.5°. At the present time, the tilt of the Earth's axis is 23.5°. When the tilt is small there is less climatic variation between the summer and winter seasons in the middle and high latitudes. Winters tend to be milder and summers cooler. Warmer winters allow for more snow to fall in the high latitude regions. When the atmosphere is warmer it has a greater ability to hold water vapor and therefore more snow is produced at areas of frontal or orographic uplift. Cooler summers cause snow and ice to accumulate on the Earth's surface because less of this frozen water is melted. Thus, the net effect of a smaller tilt would be more extensive formation of glaciers in the polar latitudes. Periods of a larger tilt result in greater seasonal climatic variation in the middle and high latitudes. At these times, winters tend to be colder and summers warmer. Colder winters produce less snow because of lower atmospheric temperatures. As a result, less snow and ice accumulates on the ground surface. Moreover, the warmer summers produced by the larger tilt provide additional energy to melt and evaporate the snow that fell and accumulated during the winter months. In conclusion, glaciers in the polar regions should be generally receding, with other contributing factors constant, during this part of the obliquity cycle. Computer models and historical evidence suggest that the Milankovitch cycles exert their greatest cooling and warming influence when the troughs and peaks of all three cycles coincide with each other. Atmospheric Carbon Dioxide Variations Studies of long term climate change have discovered a connection between the concentration of carbon dioxide in the atmosphere and mean global temperature. Carbon dioxide is one of the more important gases responsible for the greenhouse effect. Certain atmospheric gases, like carbon dioxide, water vapor and methane, are able to alter the energy balance of the Earth by being able to absorb longwave radiation emitted from the Earth's surface. The net result of this process and the re-emission of longwave back to the Earth's surface increases the quantity of heat energy in the Earth's climatic system. Without the greenhouse effect, the average global temperature of the Earth would be a cold -18° Celsius rather than the present 15° Celsius. Researchers of the 1970s CLIMAP project found strong evidence in deep-ocean sediments of variations in the Earth's global temperature during the past several hundred thousand years of the Earth's history. Other subsequent studies have confirmed these findings and have discovered that these temperature variations were closely correlated to the concentration of carbon dioxide in the atmosphere and variations in solar radiation received by the planet as controlled by the Milankovitch cycles. Measurements indicated that atmospheric carbon dioxide levels were about 30% lower during colder glacial periods. It was also theorized that the oceans were a major store of carbon dioxide and that they controlled the movement of this gas to and from the atmosphere. The amount of carbon dioxide that can be held in oceans is a function of temperature. Carbon dioxide is released from the oceans when global temperatures become warmer and diffuses into the ocean when temperatures are cooler. Initial changes in global temperature were triggered by changes in received solar radiation by the Earth through the Milankovitch cycles. The increase in carbon dioxide then amplified the global warming by enhancing the greenhouse effect. Over the past three centuries, the concentration of carbon dioxide has been increasing in the Earth's atmosphere because of human influences (Figure 7y-3). Human activities like the burning of fossil fuels, conversion of natural prairie to farmland, and deforestation have caused the release of carbon dioxide into the atmosphere. From the early 1700s, carbon dioxide has increased from 280 parts per million to 380 parts per million in 2005. Many scientists believe that higher concentrations of carbon dioxide in the atmosphere will enhance the greenhouse effect making the planet warmer. Scientists believe we are already experiencing global warming due to an enhancement of the greenhouse effect. Most computer climate models suggest that the globe will warm up by 1.5 - 4.5° Celsius if carbon dioxide reaches the predicted level of 600 parts per million by the year 2050. Figure 7y-3: The following graph illustrates the rise in atmospheric carbon dioxide from 1744 to 2005. Note that the increase in carbon dioxide's concentration in the atmosphere has been exponential during the period examined. An extrapolation into the immediate future would suggest continued increases. (Source: Neftel, A., H. Friedli, E. Moore, H. Lotscher, H. Oeschger, U. Siegenthaler, and B. Stauffer. 1994. Historical carbon dioxide record from the Siple Station ice core. pp. 11-14. In T.A. Boden, D.P. Kaiser, R.J. Sepanski, and F.W. Stoss (eds.) Trends'93: A Compendium of Data on Global Change. ORNL/CDIAC-65. Carbon Dioxide Information Analysis Center, Oak Ridge National Laboratory, Oak Ridge, Tenn. U.S.A. and Volcanic Eruptions For many years, climatologists have noticed a connection between large explosive volcanic eruptions and short term climatic change (Figure 7y-4). For example, one of the coldest years in the last two centuries occurred the year following the Tambora volcanic eruption in 1815. Accounts of very cold weather were documented in the year following this eruption in a number of regions across the planet. Several other major volcanic events also show a pattern of cooler global temperatures lasting 1 to 3 years after their eruption. At first, scientists thought that the dust emitted into the atmosphere from large volcanic eruptions was responsible for the cooling by partially blocking the transmission of solar radiation to the Earth's surface. However, measurements indicate that most of the dust thrown in the atmosphere returned to the Earth's surface within six months. Recent stratospheric data suggests that large explosive volcanic eruptions also eject large quantities of sulfur dioxide gas which remains in the atmosphere for as long as three years. Atmospheric chemists have determined that the ejected sulfur dioxide gas reacts with water vapor commonly found in the stratosphere to form a dense optically bright haze layer that reduces the atmospheric transmission of some of the Sun's incoming radiation. In the last century, two significant climate modifying eruptions have occurred. El Chichon in Mexico erupted in April of 1982, and Mount Pinatubo went off in the Philippines during June, 1991 (Figure 7y-5). Of these two volcanic events, Mount Pinatubo had a greater effect on the Earth's climate and ejected about 20 million tons of sulfur dioxide into the stratosphere (Figure 7y-6). Researchers believe that the Pinatubo eruption was primarily responsible for the 0.8 degree Celsius drop in global average air temperature in 1992. The global climatic effects of the eruption of Mount Pinatubo are believed to have peaked in late 1993. Satellite data confirmed the connection between the Mount Pinatubo eruption and the global temperature decrease in 1992 and 1993. The satellite data indicated that the sulfur dioxide plume from the eruption caused a several percent increase in the amount of sunlight reflected by the Earth's atmosphere back to space causing the surface of the planet to cool. Variations in Solar Output Until recently, many scientists thought that the Sun's output of radiation only varied by a fraction of a percent over many years. However, measurements made by satellites equipped with radiometers in the 1980s and 1990s suggested that the Sun's energy output may be more variable than was once thought (Figure 7y-7). Measurements made during the early 1980s showed a decrease of 0.1 percent in the total amount of solar energy reaching the Earth over just an 18 month time period. If this trend were to extend over several decades, it could influence global climate. Numerical climatic models predict that a change in solar output of only 1 percent per century would alter the Earth's average temperature by between 0.5 to 1.0° Celsius. Scientists have long tried to also link sunspots to climatic change (also see the link www.sunspotcycle.com). Sunspots are huge magnetic storms that are seen as dark (cooler) areas on the Sun's surface. The number and size of sunspots show cyclical patterns, reaching a maximum about every 11, 90, and 180 years. The decrease in solar energy observed in the early 1980s correspond to a period of maximum sunspot activity based on the 11 year cycle. In addition, measurements made with a solar telescope from 1976 to 1980 showed that during this period, as the number and size of sunspots increased, the Sun's surface cooled by about 6° Celsius. Apparently, the sunspots prevented some of the Sun's energy from leaving its surface. However, these findings tend to contradict observations made on longer times scales. Observations of the Sun during the middle of the Little Ice Age (1650 to 1750) indicated that very little sunspot activity was occurring on the Sun's surface. The Little Ice Age was a time of a much cooler global climate and some scientists correlate this occurrence with a reduction in solar activity over a period of 90 or 180 years. Measurements have shown that these 90 and 180 year cycles influence the amplitude of the 11 year sunspot cycle. It is hypothesized that during times of low amplitude, like the Maunder Minimum, the Sun's output of radiation is reduced. Observations by astronomers during this period (1645 to 1715) noticed very little sunspot activity occurring on the Sun. During periods of maximum sunspot activity, the Sun's magnetic field is strong. When sunspot activity is low, the Sun's magnetic field weakens. The magnetic field of the Sun also reverses every 22 years, during a sunspot minimum. Some scientists believe that the periodic droughts on the Great Plains of the United States are in someway correlated with this 22 year cycle.
(7 images)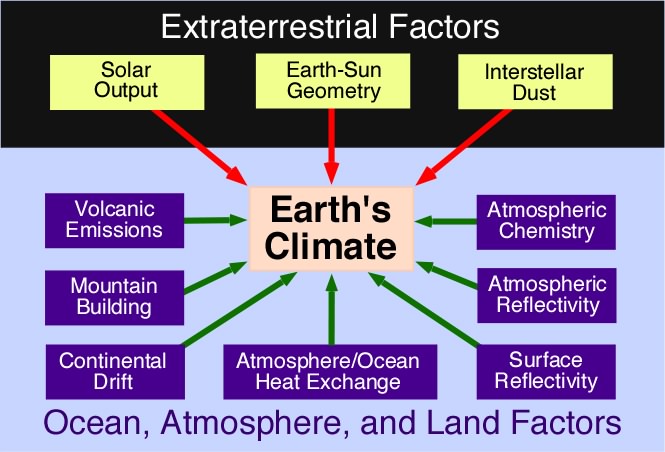
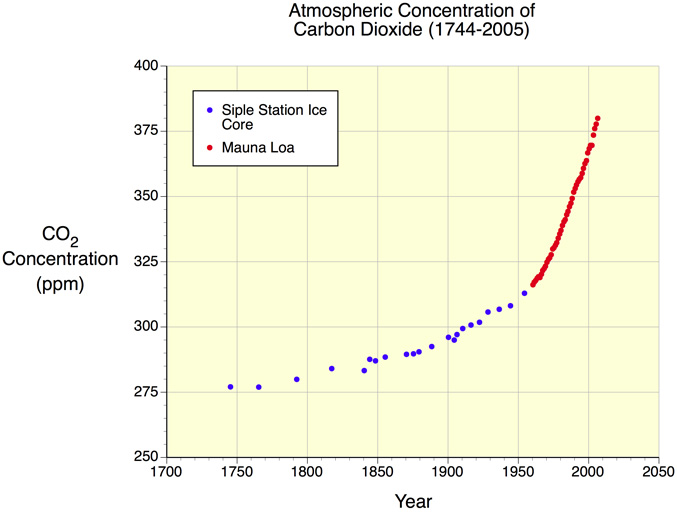
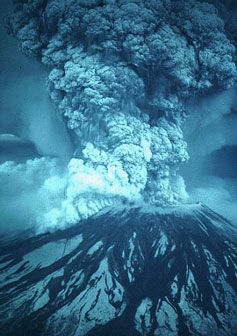
Figure 7y-4: Explosive volcanic eruptions have been shown to have a short-term cooling effect on the atmosphere if they eject large quantities of sulfur dioxide into the stratosphere. This image shows the eruption of Mount St. Helens on May 18, 1980 which had a local effect on climate because of ash reducing the reception of solar radiation on the Earth's surface. Mount St. Helens had very minimal global effect on the climate because the eruption occurred at an oblique angle putting little sulfur dioxide into the stratosphere. (Source: U.S. Geological Survey, photograph by Austin Post). 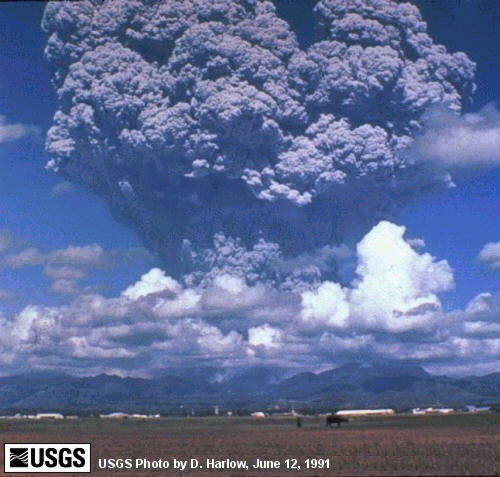
Figure 7y-5: Ash column generated by the eruption of Mount Pinatubo on June 12, 1991. The strongest eruption of Mount Pinatubo occurred three days later on June 15, 1991. (Source: US Geological Survey). 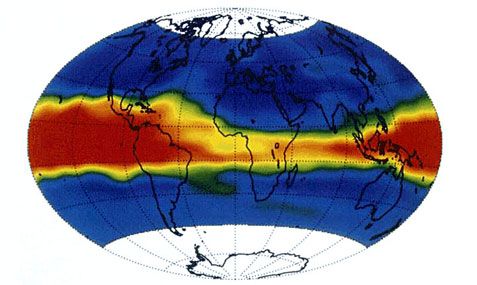
Figure 7y-6: The following satellite image shows the distribution of Mount Pinatubo's sulfur dioxide and dust aerosol plume (red and yellow areas) between June 14 and July 26, 1991. Approximately 45 days after the eruption, the aerosol plume completely circled the Earth around the equator forming a band 20 to 50° of latitude wide. Areas outside this band were clear of volcanic aerosols. Within a year, the sulfur dioxide continued to migrate towards the North and South Pole until it covered the entire Earth because of the dominant poleward flow of stratospheric winds (stratospheric winds circulate from the equator to the polar vortices at the North and South Poles). These observed patterns of aerosol movement suggest that tropical explosive volcanic eruptions probably have the greatest effect on the Earth's climate. Diffusion of aerosols by stratospheric winds from a tropical source results in the greatest latitudinal coverage of the sulfur dioxide across both the Northern and Southern Hemispheres. (Source: SAGE II Satellite Project - NASA). 
Figure 7y-7: The Sun as seen at sunset. The Sun is essentially the only source of energy for running the Earth's climate. Thus any change in its output will result in changes in the reception of insolation and the generation of heat energy which drives the climate system.
Post Comment Private Reply Ignore Thread
Top • Page Up • Full Thread • Page Down • Bottom/Latest
Begin Trace Mode for Comment # 3.
#1. To: All, *Global Climate Change* (#0)
Stories in the Ice Indeed, fallout from the Chernobyl nuclear accident has turned up in ice cores, as has dust from violent desert storms countless millennia ago. Collectively, these frozen archives give scientists unprecedented views of global climate over the eons. More important, the records allow researchers to predict the impact of significant events--from volcanic eruptions to global warming--that could strike us today.
Climate Change: Incorrect information on pre-industrial CO2 One of these processes is formation of gas hydrates or clathrates. In the highly compressed deep ice all air bubbles disappear, as under the influence of pressure the gases change into the solid clathrates, which are tiny crystals formed by interaction of gas with water molecules. Drilling decompresses cores excavated from deep ice, and contaminates them with the drilling fluid filling the borehole. Decompression leads to dense horizontal cracking of cores, by a well known sheeting process. After decompression of the ice cores, the solid clathrates decompose into a gas form, exploding in the process as if they were microscopic grenades. In the bubble-free ice the explosions form a new gas cavities and new cracks[4]. Through these cracks, and cracks formed by sheeting, a part of gas escapes first into the drilling liquid which fills the borehole, and then at the surface to the atmospheric air. Particular gases, CO2, O2 and N2 trapped in the deep cold ice start to form clathrates, and leave the air bubbles, at different pressures and depth. At the ice temperature of – 15oC dissociation pressure for N2 is about 100 bars, for O2 75 bars, and for CO2 5 bars. Formation of CO2 clathrates starts in the ice sheets at about 200 meter depth, and that of O2 and N2 at 600 to 1000 meters. This leads to depletion of CO2 in the gas trapped in the ice sheets. This is why the records of CO2 concentration in the gas inclusions from deep polar ice show the values lower than in the contemporary atmosphere, even for the epochs when the global surface temperature was higher than now. e data from shallow ice cores, such as those from Siple, Antarctica[5, 6], are widely used as a proof of man-made increase of CO2 content in the global atmosphere, notably by IPCC[7]. These data show a clear inverse correlation between the decreasing CO2 concentrations, and the load-pressure increasing with depth (Figure 1 A). The problem with Siple data (and with other shallow cores) is that the CO2 concentration found in pre-industrial ice from a depth of 68 meters (i.e. above the depth of clathrate formation) was “too high”. This ice was deposited in 1890 AD, and the CO2 concentration was 328 ppmv, not about 290 ppmv, as needed by man-made warming hypothesis. The CO2 atmospheric concentration of about 328 ppmv was measured at Mauna Loa, Hawaii as later as in 1973[8], i.e. 83 years after the ice was deposited at Siple. An ad hoc assumption, not supported by any factual evidence[3, 9], solved the problem: the average age of air was arbitrary decreed to be exactly 83 years younger than the ice in which it was trapped. The “corrected” ice data were then smoothly aligned with the Mauna Loa record (Figure 1 B), and reproduced in countless publications as a famous “Siple curve”. Only thirteen years later, in 1993, glaciologists attempted to prove experimentally the “age assumption”[10], but they failed[9].
There are no replies to Comment # 3. End Trace Mode for Comment # 3.
Top • Page Up • Full Thread • Page Down • Bottom/Latest
by Peter Tyson
Online Producer, NOVA
Nature's Time Machine
How would you like to have a time machine that could take you back anywhere over the past 300,000 years? You could see what the world was like when ice sheets a thousand feet thick blanketed Canada and northern Europe, or when the Indonesian volcano Toba blew its top in the largest volcanic eruption of the last half million years.
Well, scientists have such a time machine. It's called an ice core. Scientists collect ice cores by driving a hollow tube deep into the miles-thick ice sheets of Antarctica and Greenland (and in glaciers elsewhere). The long cylinders of ancient ice that they retrieve provide a dazzlingly detailed record of what was happening in the world over the past several ice ages. That's because each layer of ice in a core corresponds to a single year--or sometimes even a single season--and most everything that fell in the snow that year remains behind, including wind-blown dust, ash, atmospheric gases, even radioactivity.
The Ice Core Timeline requires JavaScript support in your browser. If your browser doesn't support JavaScript, please try the non-JavaScript version.
Ice Core Timeline
Special thanks to Mark Twickler, University of New Hampshire
#3. To: robin (#1)
Well, scientists have such a time machine. It's called an ice core. Scientists collect ice cores by driving a hollow tube deep into the miles-thick ice sheets of Antarctica and Greenland (and in glaciers elsewhere). The long cylinders of ancient ice that they retrieve provide a dazzlingly detailed record of what was happening in the world over the past several ice ages. That's because each layer of ice in a core corresponds to a single year--or sometimes even a single season--and most everything that fell in the snow that year remains behind, including wind-blown dust, ash, atmospheric gases, even radioactivity.
Statement of Prof. Zbigniew Jaworowski
Chairman, Scientific Council of Central Laboratory for Radiological Protection
Warsaw, Poland Determinations of CO2 in polar ice cores are commonly used for estimations of the pre-industrial CO2 atmospheric levels. Perusal of these determinations convinced me that glaciological studies are not able to provide a reliable reconstruction of CO2 concentrations in the ancient atmosphere. This is because the ice cores do not fulfill the essential closed system criteria. One of them is a lack of liquid water in ice, which could dramatically change the chemical composition the air bubbles trapped between the ice crystals. This criterion, is not met, as even the coldest Antarctic ice (down to –73oC) contains liquid water[2]. More than 20 physico-chemical processes, mostly related to the presence of liquid water, contribute to the alteration of the original chemical composition of the air inclusions in polar ice[3].
Replies to Comment # 3.
