See other (s)Elections Articles
Title: Market WrapUp (7-25-2008)
Source:
FSO
URL Source: [None]
Published: Jul 25, 2008
Author: Tim
Post Date: 2008-07-25 18:35:45 by orangedog
Ping List: *unUsual Suspects* Subscribe to *unUsual Suspects*
Keywords: None
Views: 931
Comments: 43
topmargin="0" leftmargin="0"> Financial Sense ® Home l Market Monitor l Market WrapUp l Storm Watch l About Us l Contact Us Today's Market WrapUp 07.25.2008 Mon Tue Wed Thu Fri Wood Archive In the June 27th WrapUp I explained that Crude Oil was in an unsustainable parabolic spike. Then, on July 15th I had a short-term sell signal that immediately evolved into a sell signal of intermediate degree. The question now is whether or not this intermediate-term sell signal further evolves into marking an even longer-term top, or if it is a mere correction in the path of an even longer-term advance. Monitoring the Cycle Turn Indicator at the various levels will be key at answering this question. Below is a long-term chart of crude oil showing the 1,322 percent advance that occurred from the 1998 low at 10.35, into the recent high at 147.27. Since the July 11th high, crude oil dropped 23.77 into the most recent low. This decline in and of itself does not necessarily mean that crude oil has also made a longer-term top. But, given the nature of the recent parabolic spike along with some of the other statistical factors that I’m watching, this is indeed a window of opportunity. The key item for me at this point is whether or not this intermediate-term decline is successful enough to also turn my monthly Cycle Turn Indicator negative. Also, the other key element is whether or not this occurs within the statistical window surrounding the entire commodity complex that I have been watching and telling my subscribers about for months now. Since we are on commodities, I next want to briefly discuss gold. In doing so I am also going to show you how my Trend and Cycle Turn Indicators can be used to help identify primary and counter-trend moves. The chart below is a weekly chart of gold, which I use for my intermediate-term work. I have also included both my intermediate-term Trend Indicator as well as my Cycle Turn Indicator. If we begin at the low last August, note that both the Trend and the Cycle Turn Indicator were negative as that low was made. Then, the first week in September both indicators turned up as gold began to climb out of the cycle low that was associated with that price low. With the Trend Indicator positive, this told us that the longer-term trend had turned back up. As price continued to move up, note that the Trend Indicator remained positive all the way up into the March high capturing that entire advance. When the Cycle Turn Indicator turned down at various points along the way it was signaling counter-trend cyclical moves within the context of the longer-term up trend. Then, when the Cycle Turn Indicator turned back up, another buying opportunity was confirmed. To say this another way, the fact that the Tend Indicator remained positive during the downturns, seen by the Cycle Turn Indicator, told us that these dips were buying opportunities. But, once the Trend Indicator rolled over below its trigger line in late March, it told us that the trend at this level had turned down. This also told us that as long as the Trend Indicator remained negative that any rally was to be considered a counter-trend move. The week of July 18th the Trend Indicator came within a hair of crossing back above its trigger line. However, this crossover never quite materialized and this past week the weekly Cycle Turn Indicator turned negative. As a result, the current picture suggests that the May to July rally was a counter-trend affair at this level. Until the Trend Indicator turns back up, the trend at this level remains negative and any bounce must still be considered a counter-trend move. As for equities, from a Dow theory perspective we still have a mixed bag. The longer-term primary bearish trend change that was confirmed on November 21, 2007 remains intact. This confirmation occurred when the blue horizontal line on the chart below was jointly violated by both averages. Since that violation, both an upside and a downside Dow theory non-confirmation has evolved. The upside non-confirmation occurred when the Transports moved above their previous secondary high point and ultimately into all time new highs in June, but with the Industrials failing to better their previous secondary high point this upside non-confirmation was born. To clarify, this upside non-confirmation is marked in red and has a bearish bias that until corrected will remain intact. At the same time, we also still have a downside non-confirmation, which is noted in green. This downside non-confirmation occurred when the Industrials moved below their previous secondary low point, while the Transports held above their corresponding secondary low. Downside non-confirmations are indicative of an upside reversal, which is now underway. To date, the November 21st bearish primary trend change remains intact and takes precedence over everything else. The upside non-confirmation is also bearish. But the downside non-confirmation was last to occur, and given the fact that non-confirmations tend to indicate trend reversals, we must also respect this fact as well. At present, price is advancing out of what I believe to be a secondary low point. From a Dow theory perspective, the key is whether or not this advance is sufficient enough to invalidate the existing primary bearish trend. From a cyclical perspective, which has nothing to do with Dow theory, the key is the cyclical structure of the market and the Cycle Turn Indicator at the intermediate and longer-term levels. Tim W. Wood Copyright © 2008 All rights reserved. CONTACT INFORMATION Financial Sense ® Home l Market Monitor l Market WrapUp l Storm Watch l About Us l Contact Us >

 Another Look at Crude Oil, the Dow Theory Double Non-Confirmation and Gold
BY TIM W. WOOD 


Tim W. Wood, CPA
Email l Bio | Market WrapUp Archive![]()
Copyright © James J. Puplava Financial Sense® is a Registered Trademark
P. O. Box 503147 San Diego, CA 92150-3147 USA 858.487.3939
Disclaimer
Subscribe to *unUsual Suspects*
Post Comment Private Reply Ignore Thread
Top • Page Up • Full Thread • Page Down • Bottom/Latest
Begin Trace Mode for Comment # 39.
#6. To: orangedog, Arete (#0)
I'm not too sure technical anaylisis of crude oil charts is effective, especially now. There's too much government manipulation of the markets. If you look at the crude oil chart, you'll see a big rundown prior to the 2006 election, smaller ones before the 2004, 2002 and 2000 pretend elections. Also you have geopolitical events, seasonality issues and the inevitable Xmas drops to lure the sheepsters out to the stores for their annual shearing. I think we're entering an era where essential commodities, such as energy, food and other consumer staples will continue to rise without end, with temporary drops to quell the flock when it suits the government's agenda.
Makes sense esp. in light of the debt ceiling raised to $$$ 10.6 Trillion. http://befuddledmonkey.blogspot.com/2008/07/us-debt-ceiling-to-rise-to-106- trillion.html
NAB will shock Wall Street The National Australia Bank's decision to write off 90 per cent of its US conduit loans will have dramatic repercussions around the world. Wall Street will be deeply shocked when they understand the repercussions of what NAB has done. It is clear global banks have nowhere near provided for their exposures to US housing loans which in the words of John Stewart are experiencing a “meltdown”. We are now way beyond sub-prime. NAB says that it is suffering a 55 per cent loss on American housing loans – an event that has never happened in the history of a developed country in recent memory. This is an unprecedented event and means that the cost of bailing out the US financial system is now far beyond the highest estimates. A US recession is now locked in, but more alarmingly, 55 per cent loan losses point to the possibility of a depression. It means the cost of bailing out housing exposures to the two mortgage insurers will be so great that it will leave no room to bail out anything else and there are several US banks that are now in big trouble. NAB says that the dislocation in the residential market is separate from the corporate market, but the flow on is inevitable. While global banks have been writing down their balance sheet assets, ,b>few have tackled their conduit exposures which are off balance sheet but to which they are ultimately liable. This morning at around 6am I wrote that we had been experiencing a 'dead cat bounce'. I had no idea that NAB would trigger the downturn and confirm what I had written. And of course Wall Street will receive a deep shock when it wakes up. How did NAB get caught in $1.2 billion mess? They had a number of big clients who wanted to invest in these US housing loans. They were sucked in by the 'triple A rating' given to the securities by the rating agencies. They did not take into account that the monoline insurers who guaranteed some of the loans had no substance. To become a player NAB took out $1.2 billion in these triple A securities and 90 per cent of it has been lost. Many Australian institutions are very angry. NAB is paying out far too much in dividends and should be conserving capital. The American bank it purchased, Great Western, was a good idea but it is now clear it overpaid for it. Fortunately it only has a small exposure to the bad loans. But what’s happening to the NAB is not the main game. The global banks have been marking to market the assets they held on their balance sheet, but,b> the vast amounts held in so called 'conduit trust accounts' have not been written down because they were not marketable. NAB wrote them down when they saw the bad mortgages. US banks have written down $450 billion in bad housing loans. The revelation from NAB means that they will now certainly need to take provisions to $1,000 billion. But write-downs of $1,300 billion and perhaps even more are on the cards. Where will the equity come from to cover these bad loans? The world has never attempted a rescue effort of this size and it will make liquidity in the globe very tight.
Holy shit, Shirley!
My take is ... Holy Shit Batman, somebody turned on the fan.
Ladies and Gentlemen, we are at the 'flation' fork in the road. Will it be in- or de-? My unsophisticated guess is in-flation. Here is why. We, the US, the World, the Planet is standing right at the fork in the road and the choice will not be to bankrupt the system nor the US Government. For decades the US has been running on deficit financing, especially by the government. But all have been doing it, from individuals, corporations, Wall Street and of course the government. 'IT' will continue, especially by the US Government. Now I will only look at the real estate market. The unrealized wealth was the fact that one could acquire real estate easily. That real estate would then increase in value whether from flation, improvements or desirability. Over the decades while this was going on more wealth was created and that wealth was realized thru re-financing or selling. Regardless of how and what the transfer was there was an increase in wealth and an increase in money as new financing was put into place to cover higher and higher values. Wall Street figured this out and realized they could essentially print their own money by coming up with larger and larger financings which then got made into bonds. Those bonds and financings that are due sometime in the future are the new money. Hey, just like the government does, in its partnership with the FED. That wasn't too hard to figure out, huh. But they were collateralized assets. The US has faith in the US as collateralization for Dollars. A little harder to figure on than the black and white or real estate as collateral. Collateral which is dropping in value like a rock. Now that those bonds and financings and of course the collateral itself, the real estate are dropping in value, the US Government will print the real dollars, money to prop up and bail out those collateralized assets. i.e. the Fannie & Freddie bailout bill going thru Congress. That is highly inflationary because it is giving a false, higher value to assets that are worth 10¢ on the Dollar. See posts #2 & #9 above. This along with the deficit spending that the US Government has been doing for the last many decades means, more US Dollars being printed and put into the system that are backed by nothing or worse yet backed by bonds which are now worth 10¢ on the Dollar. That's instant devaluation and the money to prop it up is now on the street in circulation. Yes Ladies and Gentlemen ... we will have in-flation! And regardless of whether it is in-flation or de- flation, both will put everyone into both realized and unrealized poverty. Unrealized wealth is no longer an option or a possibility. The unrealized portion of our poverty is in the Trillions. And it will be realized. Only the time component is uncertain.
Excellent analysis...you and Edgar Steele are on the same page.
You and all are welcome. Now for the miners data. Your turn to analyze. I have changed it quite a bit. What has happened is the the gold highlighted boxes for the miners are those miners that are in the GDX Index. Those miners that are in bold red and the gold highlighted boxes are in both the HUI and the GDX. Only FCX is the in the HUI only. I now have a sort for 2008 for the HUI and the GDX separately. As can be seen the top miners are generally the same for both indexes. By playing the top miners, one can easily beat the HUI Index or the GDX ETF. Now for the overall miner's handicap. POG was down -2.63% and POS -3.98% and therefore the miners as a group were down -7.09%. They all went in the same direction, yay. Quick note: Aurelian (ARU.TO) is being bought out by Kinross (KGC), that's why the big jump. Probably also the reason for the 17% dump by KGC. Well GSPG is still the shooting star of the whole crowd. I'm going to show more on them in a later post. KBX and the crowd are falling back further. Like everybody is saying, there are some really good miners here that are just getting sliced and diced into oblivion. Look what happened to BVN. They did a stock split and wound up lower. What usually happens is the opposite. Next week I'll have the value corrected for the stock split so that the percentage for BVN will be correct for the year. Giving everyone a chance, here is the sort for the winners for the week only. Wow, if you gained 0% or lost 0% (just making fun) you wound up pretty highly ranked. Courtesy of P. 'Fearless Leader' da Wit
Yep. If you got the return 'of' your principal, you are a genius these days.
"Mr. Noe should not expect to somehow profit from the fact that we were successful," said William T. Bodoh, the retired bankruptcy judge who oversaw the liquidation with Chicago-based Development Specialists Inc. So, do you think Ohio will prosecute the pension fund investors who lost money, if earning beyond your principal will not protect you from prison?
Here is the HUI. I followed the daily movement of gold by carving out a bottom on Thursday and breaking the downtrend by having an up day on Friday. That bottom on Thursday is also a slightly higher low. Could there be a 4th slightly higher high ? It is trending that way since May. With the last downtrend the 394 FIBO line was not touched at all. The RSI is showing some reaction from by curling upwards. Really not too much to say. Things are looking up for the miners but that is conjecture on the future which can wait a few more days for more development. Courtesy of P. 'Fearless Leader' da Wit
Here is GSPG with an overlay of FIBO lines as I employ them. The lines portray a growth pattern that according to Fibonacci, follows Mother Nature and the way of the physical universe as scientifically observed and demonstrated by all life on Planet Earth and maybe throughout the entire Universe. Because of this kind of correlation and success in doing my brand of TA, I prefer to continue employing Fibonacci in this fashion rather than by employing it strictly for pull back and correction phenomena in the market place. There are a lot of lines here to sort thru but by just observing each 100% to 0% cycle by itself, it becomes quite evident how the pricing reacts to each line in the classic manner that Fibonacci observed and put into formulae. Note: StockCharts does not employ enough digits past the decimal point to give good readings as to the price labels on the FIBO lines. Because of this I also create a mathematical table employing enough digits to get true readings. Those true numbers readings appear in what I call the FIBOmeter. Here is what that looks like. There is a top row with several FIBOmeter cycles, one after the other. Below that is just one of those cycles expanded, the one that is currently in play. Next target, 4.95¢ after the current target of 4.13¢ is achieved.
dah Dollah is giving some 'bad' signals. Friday is stayed in the lime line channel but it produced a Doji, Star Symbol. This is an indication that the market has no commitment in either direction. It is typically a presage to a change in direction and in this case it looks like the Southern Cross which can only be seen in the southern hemisphere. The bottom of that red cross also punched thru the bottom of the lime line channel. Are we about to see a lower low compared to the May 8th peak ? Courtesy of P. 'Fearless Leader' da Wit
Swiss national bank placed 68 tonnes of gold in the market in first half ZURICH, July 25 (Reuters) - The Swiss National Bank placed 68 tonnes of gold in the market in the first half of the year as part of a programme to sell a total of 250 tonnes by the end of September 2009, the central bank said on Friday. The central bank said this meant roughly another 37 tonnes of tonnes of gold were yet to be sold as part of the programme. In June 2007, the SNB said it would sell 250 tonnes of gold by September 2009, in line with the agreement among European central banks to limit gold sales to 500 tonnes a year.
Why? And what are they getting in trade for their gold? This sounds totally nutty to me.
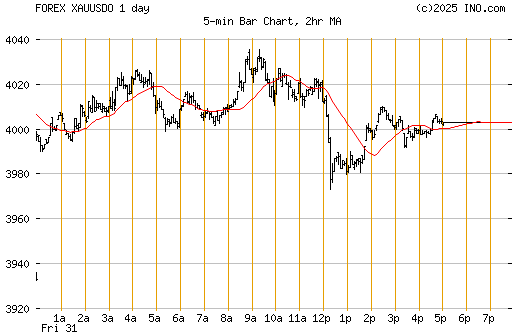
POG also had a Doji. It is more of a true star though. To get further inference, the chart shows that Thursday made a bottom. Friday was both above the lime line and the fuchsia line. The fuchsia line says that Monday's minimum target is above the FIBO line of $935.89. We shall see. I put the latest lime line one day earlier to actually tighten up and make Monday's performance to maintain this trend tougher. No slack given on gold as in the Dollar. So far no action of note in Asia. Courtesy of P. 'Fearless Leader' da Wit
#40. To: All (#39)
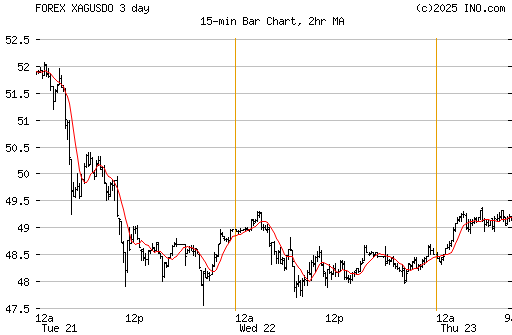
To give some relativity to what happened I have left the old red downtrend line in from da Boyz. As can be seen, not until Friday did POS break away from the pull of this red downtrend line. I have put in the lime and fuchsia line standardly. Those say that POS is at the bottom of a new uptrend and that $17.56, the 50dma has to be met for both of these lines to stay valid. Courtesy of P. 'Fearless Leader' da Wit
Hong Kong to launch first gold exchange-traded fund HONG KONG: Hong Kong is set to launch its first exchange-traded fund, which will track the price of gold. The World Gold Council, which is sponsoring the fund, said the facility will allow Hong Kong investors to trade the yellow metal without actually buying physical gold. Inflation in Hong Kong has been steadily rising in recent months, hitting 6.1 per cent in June, and investors are keen to cash in on gold to preserve their wealth and hedge against rising prices. Hong Kong's market regulator, the Securities and Futures Commission, has given the green light for the launch of the SPDR Gold Trust by the World Gold Council and investment firm, State Street Global Advisors. The exchange-traded fund will be listed on the Hong Kong Stock Exchange. It will track the price of gold and is backed by actual bullion which is kept in a HSBC vault in London. Sammy Yip, Head of Exchange-Traded Funds (Asia Pacific), State Street Global Advisors, said: "You may trade these gold shares in exactly the same way you trade any stock. There's not much requirement for you. As long as you have a brokerage account, you are able to trade this gold ETF very efficiently." Investors must make a minimum order of ten shares, with one share based on the price of one-tenth of an ounce of gold. Hong Kong's listing follows the footsteps of a similar fund launched in Singapore and Tokyo, but the fund's manager said there will be no rivalry between the three markets. "We are talking about three different markets and the underlying investors' characteristics are also different. So I believe the listings basically will be able to offer more to investors to participate in this product," said Yip. In these times of economic uncertainty, the World Gold Council said gold should appeal to long-term investors here as it is typically less volatile than other commodities. The gold exchange-traded fund will be listed on Hong Kong's stock exchange on July 31.
Top • Page Up • Full Thread • Page Down • Bottom/Latest
#7. To: Esso (#6)
food and other consumer staples will continue to rise without end
#9. To: angle (#7)
#10. To: DeaconBenjamin (#9)
#20. To: Esso (#10)
Holy shit, Shirley!
#23. To: All (#20)
unrealized wealth to unrealized poverty!
#24. To: imawit. all (#23)
And regardless of whether it is in-flation or de- flation, both will put everyone into both realized and unrealized poverty. Unrealized wealth is no longer an option or a possibility. The unrealized portion of our poverty is in the Trillions. And it will be realized. Only the time component is uncertain.
#26. To: lodwick (#24)
Excellent analysis...


#27. To: imawit (#26)
#30. To: lodwick (#27)
The bureau calculated that had the $50 million been invested in a conservative money-market fund, three-month U.S. Treasury bills or a stock-index fund, it would have earned between $13.7 million and $16.5 million.
#31. To: DeaconBenjamin (#30)
Next portion of the wrapup.

#32. To: All (#31)
Wanted to share this with y'all.


#33. To: All (#32)
Uh Oh!

#34. To: imawit, deaconbenjamin (#33)
#35. To: All (#34)
(Edited)
#36. To: DeaconBenjamin (#35)
In June 2007, the SNB said it would sell 250 tonnes of gold by September 2009, in line with the agreement among European central banks to limit gold sales to 500 tonnes a year.
#38. To: lodwick (#36)
Here's another take on the Australian write down on Friday.
#39. To: All (#38)
With that note, here's gold.

Replies to Comment # 39. Silver has really taken a hit in the last two weeks.

#42. To: imawit (#39)
So far no action of note in Asia.
End Trace Mode for Comment # 39.