Authored by Jesse Felder via TheFelderReport.com,
Back in early February of 2020, I noted that, even as the major stock market indexes had pushed to new highs, a number of Hindenburg Omens had been triggering on the NYSE and the Nasdaq pointing to a significant deterioration in breadth:
“While an individual signal has very little value in forecasting a stock market crash… a cluster of signals can be valuable in that it signals a pattern of dispersion that is not compatible with a healthy uptrend.”
In other words, where there’s fire (flames in the chart below) there’s smoke (a warning signal).
The following six weeks of stock market action proved the value of this sort of signal yet again.
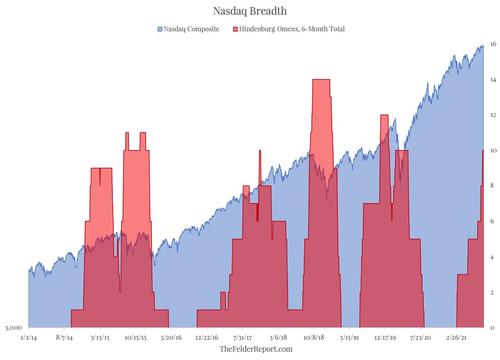
As has been widely reported, stock market breadth has been showing signs of deterioration again recently.
Specifically, a total of 10 Hindenburg Omens have triggered on the Nasdaq over the past six months, a level that has regularly warned of significant stock market turbulence ahead.
Of course, this is only a single indicator and, as such, has limited value in the context of a complex system like the stock market.
But due to the success of its track record in forecasting equity weakness, investors ought to consider just how much general market risk they’re comfortable taking on at present.
Poster Comment:
The Hindenburg Omen is a technical indicator that was designed to signal the increased probability of a stock market crash.
It compares the percentage of new 52-week highs and lows to a predetermined reference percentage.
In practice, the Hindenburg Omen is not always correct, but it may be used with other forms of technical analysis to decide when it's time to sell.
The above is from Google. But there have been 10 in the last 6 months.