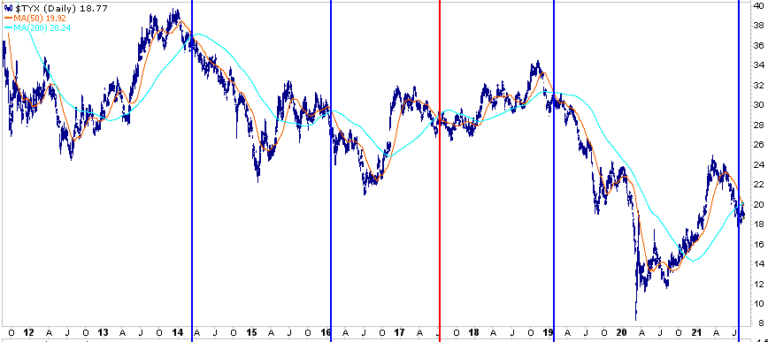
The graph below shows 30-year UST yields with its 50 and 200 dma’s. The vertical lines highlight the last five times, 30 year yields have witnessed its 50 dma falling below its 200 dma, also known technically as a “death cross.” In 3 of the last 4 death cross instances yields fell appreciably and reached record lows. The only time they didn’t was in 2017 (red vertical line). At that time yields consolidated to negate the death cross. As shown, on Monday 30-year yields witnessed a death cross.