As of 2024, nearly two-thirds (65.7%) U.S. households owned their home, while the rest rented.
However, homeownership rates vary widely across states and between urban, suburban, and rural areas, reflecting differences in affordability, housing availability, and local economic conditions.
In the map below, by USAFacts, Visual Capitalist's Kayla Zhu visualizes the share of households that are owner-occupied by state in 2023.
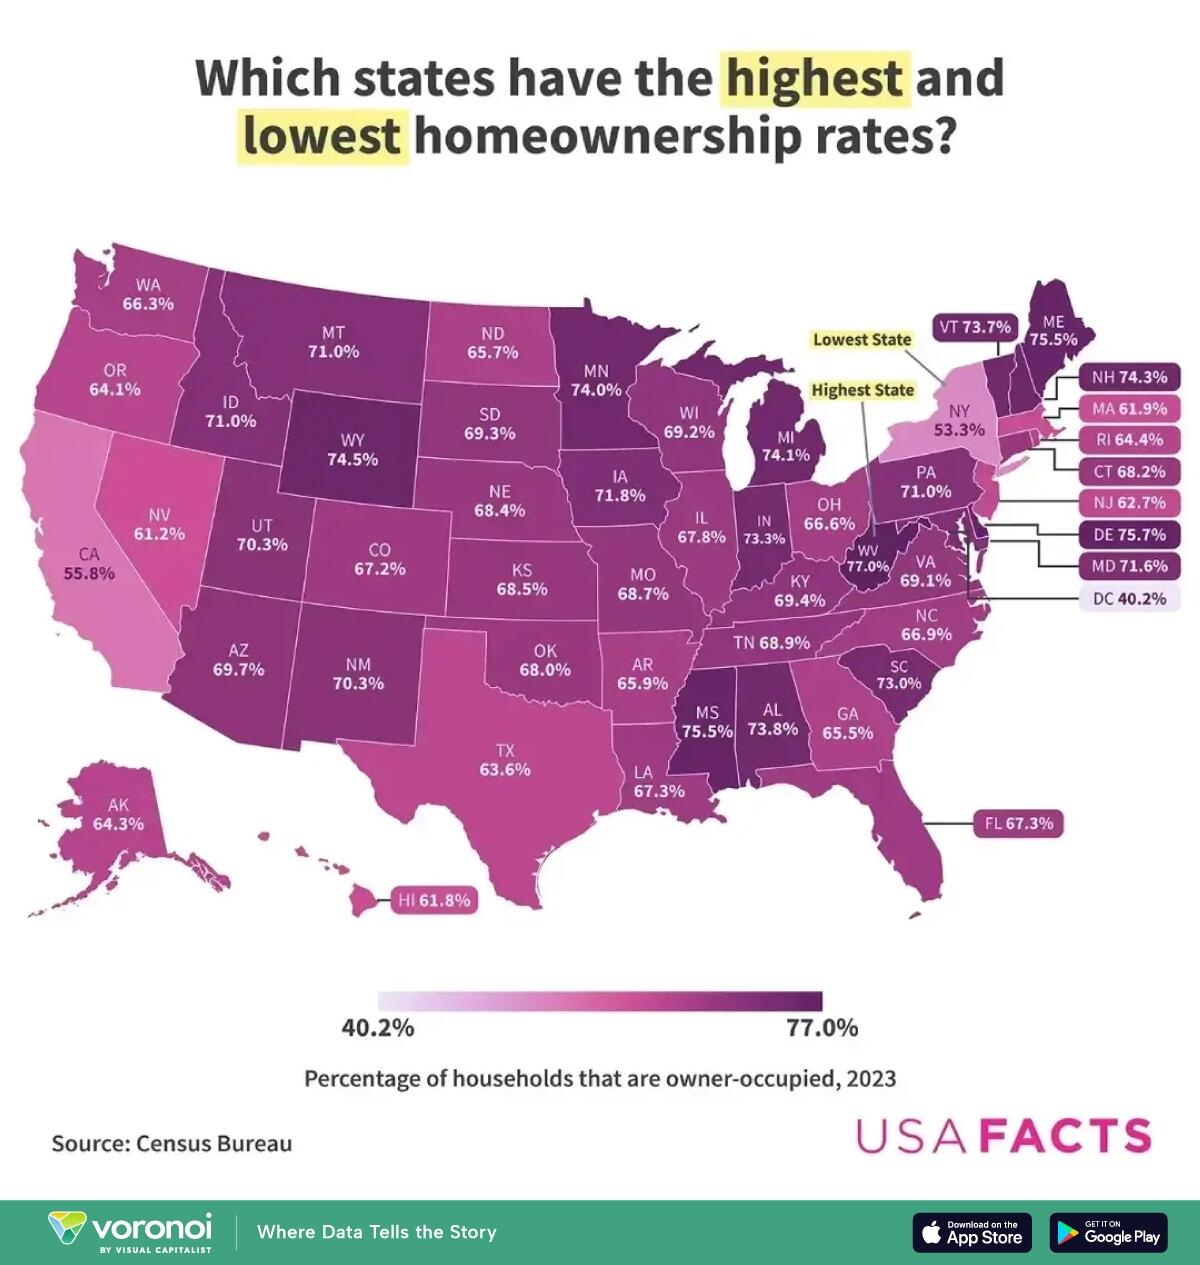
West Virginia had the highest homeownership rate in 2023, with 77% of households owning their homes.
One key factor behind West Virginia’s high ownership rate is its relative affordability. The state consistently ranks among those with the lowest median home sale prices, and it has the lowest home price-to- income ratio in the country.
Additionally, the state’s largely rural landscape and lower population density may contribute to its high homeownership rate, as housing availability is less constrained than in densely populated urban markets.
In contrast, states with the lowest homeownership rates such as Hawaii, California, and New York, also have some of the highest home prices and home price-to-income ratios, making ownership less attainable.
Places like New York and Calfornia also face high demand in urban centers, a greater share of renters due to job concentration and lifestyle preferences, and tend to have stricter zoning regulations.
This pattern highlights that while affordability plays a significant role, homeownership rates are also influenced by factors like housing supply, economic opportunities, and regional job markets.
Poster Comment:
More important would be to list the average mortgage payment and property tax payment by state. What would happen to the person who lost a $150,000 a year government job to DOGE who caould not get a job in a year and could not pay their total 12 month property and mortgage bill of $96,000?
Chart wiht state data ranked in order does not copy. See it at source