Authored by Bryce Coward via Knowledge Leaders Capital blog,
The US dollar is on the verge of breaking down to the lowest level since 2014.
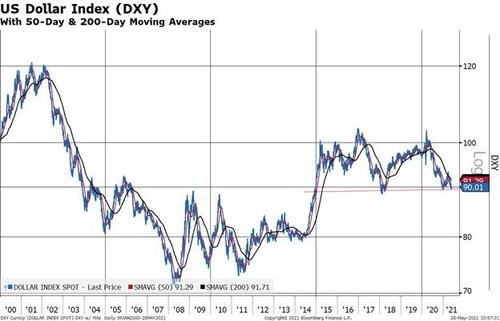
This is not all that surprising. After all, the US money supply continues to grow at a rapid pace relative to other countries and quantitative easing is likely to continue at full pace through the end of 2021. Meanwhile, other countries like the UK, Canada and others are already telegraphing rate hikes. Not only that, but the US budget deficit as a percent of GDP – which has a tight correlation with the level of the US dollar index – is set to explode through 2022 and beyond. The ballooning budget deficit suggests a level of 70 or 80 on the US dollar index over the coming years would not be out of the realm of possibilities. That would equate to a further decline of 11% to 22% from here.
If the US dollar drops below the 90 “line in the sand” and starts on a path toward 80 in the back half of 2021, that would have fairly large ramifications for stocks.
In this post we’ll briefly highlight one.
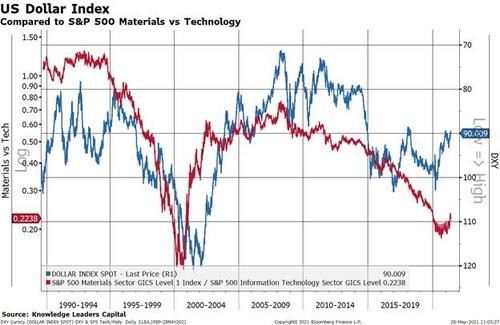
For the last 15 years or so one of the most persistent trends in the equity market was the relative outperformance of US technology companies vs basic materials companies. The red line in the chart below shows the relative performance of materials vs tech. Since 2005 the red line has gone nowhere but down – meaning tech was outperforming materials – until recently. The blue line in the chart is the US dollar index, inverted. As tech was outperforming materials, the US dollar index was going up most of the time…until recently. The tight correlation between the US dollar index and tech/materials relative performance suggests further weakness in the US dollar will be accompanies by a rather large and important rotation out of tech and into materials. For passive investors this is tricky and risky because the tech+ sector accounts for more than 40% of the S&P 500.
There’s also a fundamental case to be made for such a rotation. The relative valuation level of materials companies vs tech companies is well below average. The next two charts display the price/earnings ratio and price/book value ratio, respectively, for materials vs tech companies. The green line shows the average relative valuation since 2006.
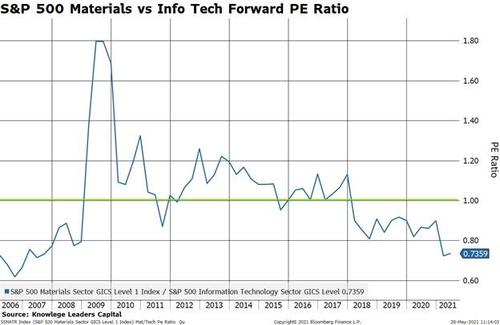
Valuations must always be put in the context of earnings growth. Tech stocks are supposed to be the high growth engines of the market, so they should, in theory, receive a higher valuation than other lower growth companies. However, the relative growth between materials and tech companies is normalizing and is currently above the historic average. This doesn’t mean that materials companies will grow faster than tech companies (even though that could certainly happen), just that growth rate difference between the two groups is shrinking.
In sum, we have poor trends in the US dollar that are being driven by fundamental factors of money supply growth and budget deficits. These factors could push the US dollar down to 70 or 80 in the coming years, which would have substantial effects on financial markets. One of those effects could be to see a continued rotation out of tech and into materials, which is a trend supported not only by a weak US dollar but also changing valuation and fundamental trends between the two sectors. That kind of rotation is likely to be more difficult for passive investors than active ones given the rather large weighting of tech and tech-like companies in the major indexes.
Poster Comment:
China might have floods again like last year. US food production will be down due to drought on the West Coast and very bad weather outside the US South. Biden will not stop selling food to China so food prices will spike higher hurting consumer products industries.
#1: TommyTheMadArtist To: Horse (#0)
Whenever half the country is on welfare of some kind, rent and food prices go up because the market allows it. Here where I live, if I shop in the richer areas, prices are lower than in the poor ones. Why? Because there are more poor people on welfare.
TommyTheMadArtist posted on 2021-05-30 16:35:20 Reply Private Reply
#2: BTP Holdings To: TommyTheMadArtist (#1)
I am lucky to have an EBT card for food stamps. The thing is with using that card is you do not have to pay sales tax.
We used to have two grocery stores here in this town, plus a couple of Dollar stores. Cash Saver closed so we only have Wal Mart to go to now.
There was a plan to turn the old Cash Saver store into a marijuana growing operation. They already had the state permits but the city would not give them a business license because of the churches and schools in town. And this happened in a place we lost about 500 jobs in a few years time due to downsizing and moving the work elsewhere. ;)
BTP Holdings posted on 2021-05-30 18:56:49 Reply Private Reply
#3: Horse To: TommyTheMadArtist (#1)
Horse posted on 2021-05-30 21:49:02 Reply Private Reply